Numbers in the newsroom
Five tips on numbers and figures that can take your research to another level.
Available in:

By Sacha Muñoz Vergara. Published: December 27, 2021.
Numbers can be a terror for some journalists, but there are ways to overcome that fear. Selecting the correct number for the right place in a story depends on the same informational judgment used to choose the accurate quote, anecdote, or image.
Storytelling requires journalists to develop the confidence to select the numbers needed for research. Of course, no number is perfect, but one should make every effort to get it as close to the truth possible.
To help you in this task, we share some mathematical recommendations based on the book Numbers in the Newsroom by Sarah Cohen. Remember that numbers give credibility as long as they are well contextualized and have a reason behind them.

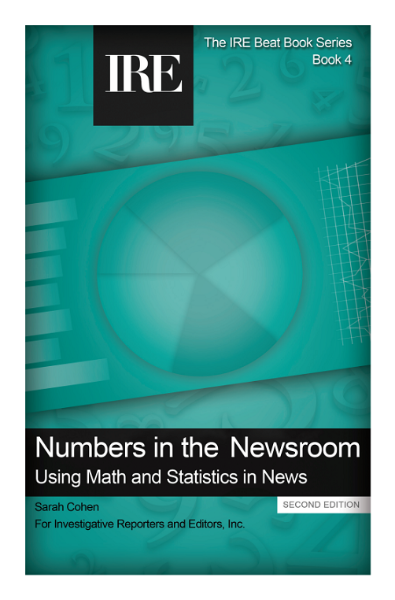
Cover of the book Numbers in the Newsroom: The Use of Mathematics and Statistics in the News.
1. Keep the number of digits below eight in a paragraph
It’s not a good idea to bombard audiences with many complex numbers. Separate the numbers into different sections.
Cohen states that eight digits per paragraph are a good number: “Generally, this gives you the ability to fit a year and two substantive numbers into one paragraph.” and also forces the journalist to focus only on the critical data.
He further gives the following example:
- “The Redundancy Office budget increased 48 percent in 2013, from $700.3 million to $1.03 billion”.
- It could change to “In the last year, the Redundancy Office budget grew by almost half, to $1 billion”.
2. Memorize some standard numbers from the field you are researching
How do you size up how big or small a number is? You can memorize some common numbers for the research topic and keep them in mind when writing. Each area has its specialized numbers that allow you to compare.
The author mentions that, for example, “in education, you can include teacher salaries, school district budget, and the pass rate of students in the best and worst-performing schools […].”
3. Round off the numbers
Precision is not always necessary. According to Philip Meyer, in Precision Journalism, “decimal points are for meaning, not the emphasis.” For example, in reporting, it would be enough to know that the population in the U.S. is more than 300 million. Likewise, it is enough to evaluate whether any other number is large or small.
4. Learn to use ratios
Ratios are a quantified relationship between two quantities that reflects their proportion of some kind. They can be a percentage, a percentage difference, a rate, or a value per person.
We can’t think clearly about very large or tiny numbers. You can picture the number 5, but the picture becomes fuzzier if you think of 39,555. Numbers should be understandable, which can be achieved by using simple proportions.
5. Use everyday mathematical operations
If you shop at sales, follow sports, or tip at a restaurant, you know how to do most of the math used in data journalism. You simply have to convert questions to that scale.
“If you know that Hispanics make up more than 15 percent of the U.S. population, it doesn’t take much work to figure out how many people that is. It’s like calculating a small tip on a restaurant bill,” says the author.
If you want to learn more about telling data-driven stories, we invite you to visit our blog and use our tools.


