


General

Independence in the Americas: A Historical Overview
When discussing the independences in the Americas, it is essential to go beyond merely knowing the …


5 Types of Visualizations to Enhance Your Infographics
Would you like to learn how to tell stories through data? Here are five visualizations that are not …

Gastronomic Trends 2024: Café Datasketch and Data Technology in Restaurants
In the neighborhood of Quinta Camacho in Bogotá, amidst the aroma of freshly ground coffee and the …
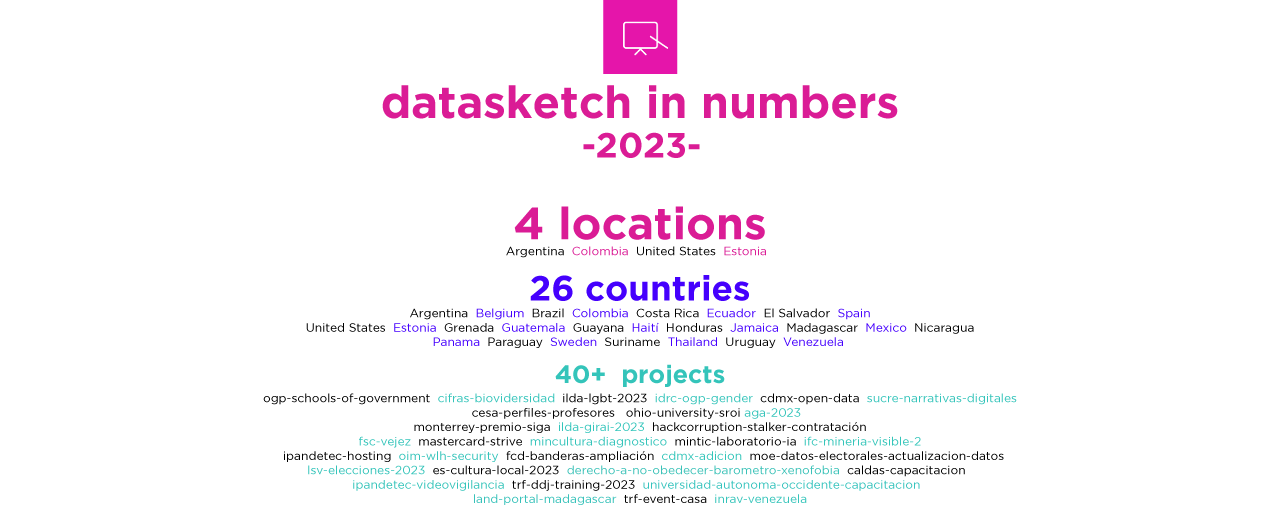
2023 in Numbers - Datasketch Newsletter #42
Data Science | Product | Artificial Intelligence
Advocacy against Violence - Datasketch Newsletter #41
Women | Internet | Rights

Eye on Privacy - Datasketch Newsletter #40
Central America | Video surveillance | Privacy
Technology Solutions in Action - Datasketch Newsletter #39
ABRELATAM | Open Data | CKAN

Accessibility and Visualizations for Social Change - Datasketch Newsletter #38
Visualizations | Artificial Intelligence | Public Procurement
Inform yourself before choosing - Datasketch Newsletter #37
Media | Public Procurement | Elections
Evidence to Propel Journalism - Datasketch Newsletter #36
Investigative Journalism | Civic Technology | Press Freedom
Next stop: OGP Global Summit - Datasketch Newsletter #35
OGP | Action Plan | Inclusion
Rights in Motion - Datasketch Newsletter #34
Migration | Human Rights | Xenophobia

The Economic Outlook - Datasketch Newsletter #33
Economy | Sustainability | Aging
AI Perspectives - Datasketch Newsletter #32
Artificial Intelligence | Work | Journalism
The Horizon of Accessible Information - Datasketch Newsletter #31
Video Surveillance | Older People | CSOs
Diversity as Seen from the Evidence Datasketch Newsletter #30
Diversity | LGBTIQ+ | Latin America and the Caribbean
Proud of These Projects - Datasketch Newsletter #29
Rights | LGBTIQ+ | Americas
Data for Cities - Datasketch Newsletter #28
Cities | Trees | Technology
Pandemic goes, inequalities remain - Datasketch Newsletter #27
COVID-19 | Contracts | Corruption

Carrasco: "To talk about data protection is also to talk about redistribution"
Carlos addresses the challenges of data use in municipalities.
Toward an Open Americas
América Abierta is a regional meeting of diverse communities that seeks to connect actors to work …
There is a future if there is truth
We dedicate a special issue of our newsletters to the final report of the Truth Commission because …
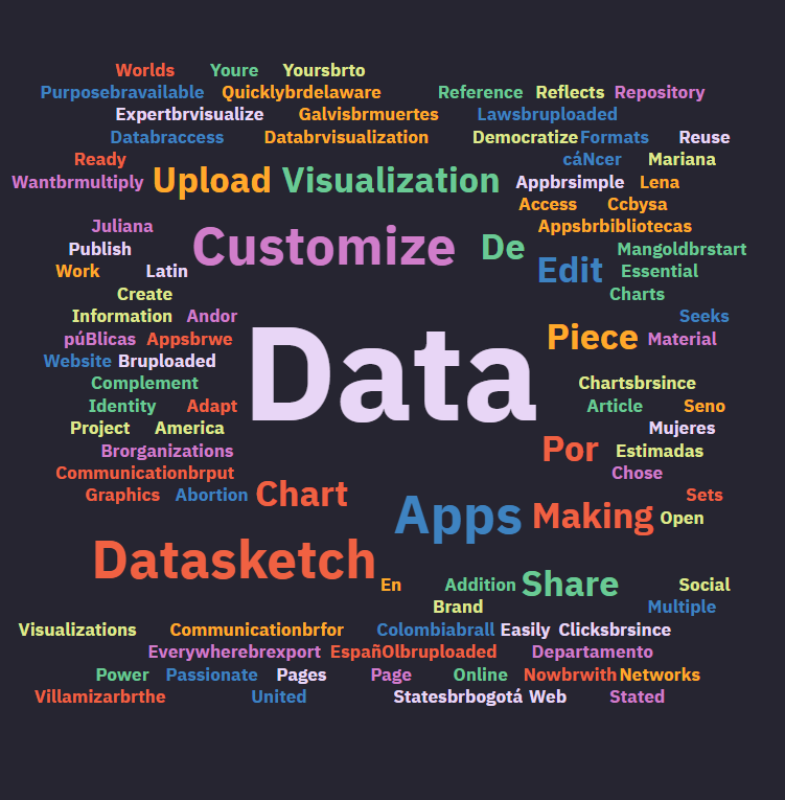
Text Visualization: Word Clouds
Data visualization is usually related to graphical representations of numbers, but when the …

#AccesoALaInformacionYa
Access to public information is a fundamental right for citizens to build better relationships with …
Reflections for Democratic Data Governance in Colombia
We reviewed Colombia's draft National Data Infrastructure Plan, collaborating with the Karisma …
#DataPrivacy
Digital technology promises to speed up processes, but what do we stand to lose when we give up a …

Climate Change is a Matter of Social Justice and Human Rights!
Xiomara Acevedo tells us about young journalists' path to confront climate change and strengthen …

Data Visualization: Alluvial Diagram
An alluvial diagram or alluvial plot is a type of visualization that shows changes in flow over …
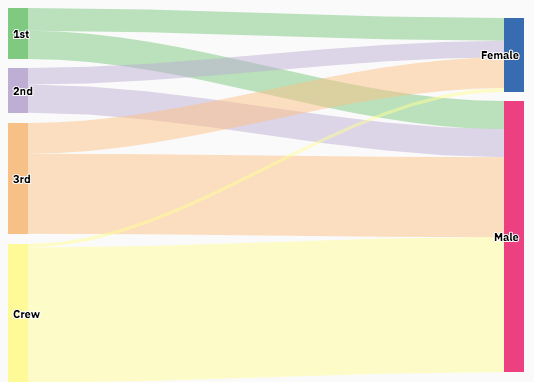
Data visualization: Sankey Diagram
The Sankey diagram is a type of data visualization that allows you to graphically represent the flow …

Copy and paste? The challenges of copyright in the digital world
"Copy and paste" practice, if copyright guidelines are not followed, can become a punishable …
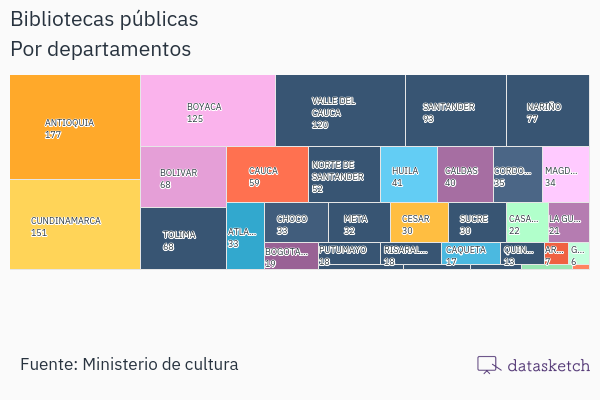
Data Visualization: Treemap
Treemap is a type of data visualization that displays data hierarchically. Here you will find its …

Data Visualization: Bar Chart
We explain to you their characteristics, possible uses, and the different types of bar charts.
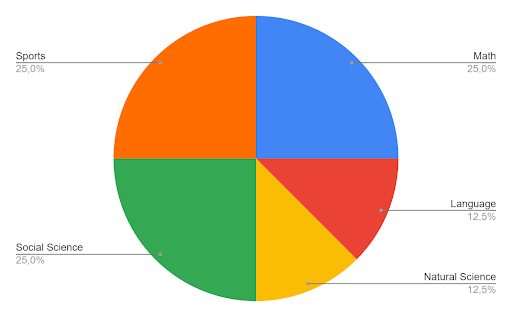
Data Visualization: Pie Chart
The pie chart is a pictorial representation of data that makes it possible to visualize the …
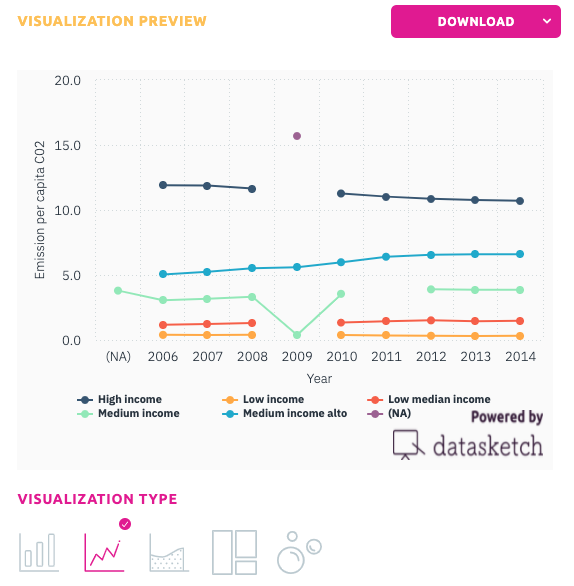
Data Visualization: Line Graph
Learn how to use a line chart and when, its advantages and disadvantages and which of our apps to …

How I got 10.000 emails for launching our newsletter
Tips and tricks to grow your email list from people you already know. Datapreneur.