


Text Visualization: Word Clouds
Data visualization is usually related to graphical representations of numbers, but when the information to be displayed is textual you can use a word cloud.
Available in:
Data visualization is usually related to graphical representations of numbers, which allow for more precise analysis of information and identification of trends. But when the information displayed is textual, there are tools to visualize this type of information, and one of the best known is the word cloud.
What is a word cloud?
It is a graphical representation or image of a series of keywords or tags organized by color and size to form a figure. It is also known as a tag cloud or tag cloud.
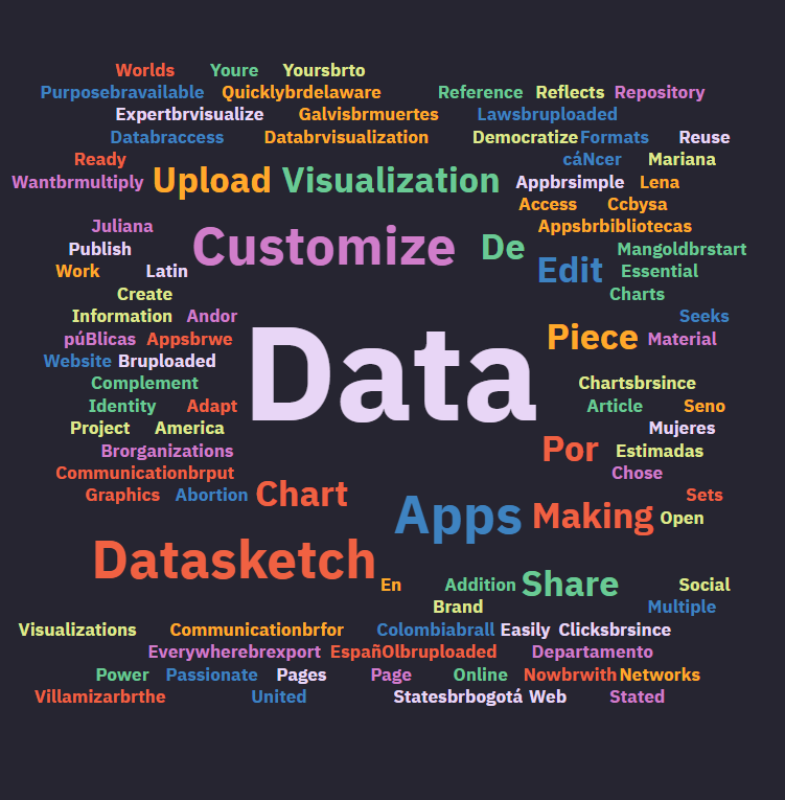
Source: Word cloud created using Words Cloud from the Datasketch home page.
How is a word cloud used?
The word cloud allows you to identify the most relevant topics at a glance. It is often used in blogs and websites to help users find information more easily.
Another less common but tremendously helpful use for data journalism is its use as a resource to display textual information in articles.
Usage example: New York Times
In mid-February and in the wake of various global events, the Morning Consult Company surveyed 2200 Americans. They asked about the perception of inflation in the country and its perceived products.
According to the Gallup Group Index, inflation was one of the three biggest concerns at the moment, above unemployment.
The New York Times collects the results of this research and shows it using word clouds in its article “Where 2200 Americans Have Noticed Inflation”. They analyzed the most repeated terms in the participants' open-ended responses.
We should note that these data do not capture price increases due to the conflict between Russia and Ukraine. Still, they identified that the answers somehow show that citizens and states perceive inflation differently. According to the media, dozens of participants pointed out that inflation is in all products, but the most concerning areas are fuel and food. The image highlights in orange the categories that represent food and allows us to see the relevance of this issue.
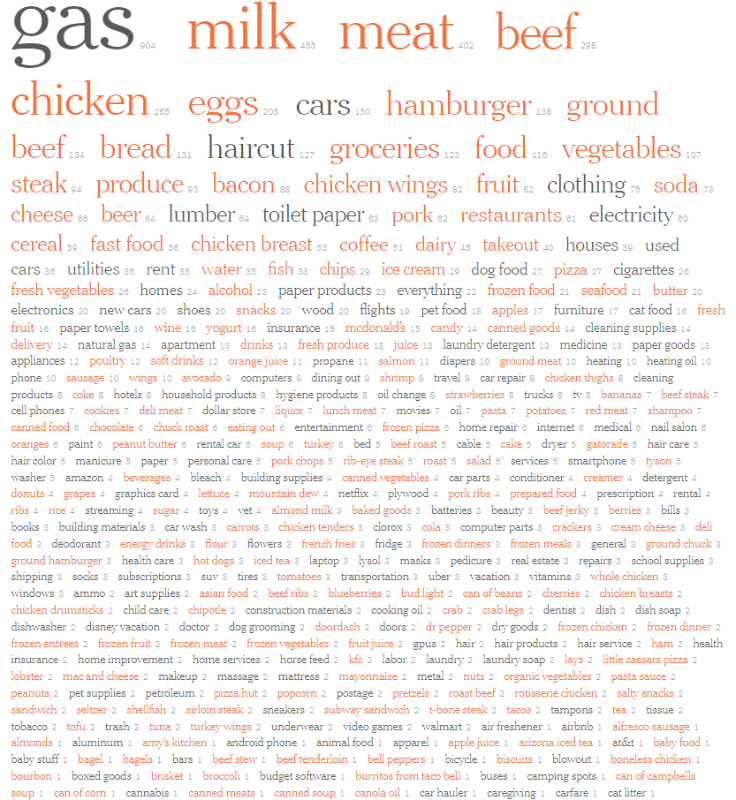
Source: Bacon, Gas, and Essentials: Where 2,200 Americans Have Noticed Inflation | The New York Times.
Inflation affects most of those who have the least, and being clear about the areas that most concern people in their day-to-day lives can help make policy decisions and identify areas of impact that will help improve people’s lives.
It is transparent and straightforward visual information. It’s not explained in text, but graphically. It’s handy for creating relationships between concepts. You often don’t have a global vision of what terms you can use. So another key is to understand that it helps you identify words that you can relate to, generating new concepts.
Recommendations when creating word clouds
This tool has a great potential to show the most salient information of a text. For that, we must:
🎨 Explain what the colors mean in our visualizations.
The colors chosen can mean many things, such as the predominance of a term in the text, the relationship between different representations (in the example above, all the words in orange are food), or can be random, and the reader should know them beforehand.
📋 Explain what the differences in the size of the terms mean.
Usually, the size depends on how regularly the label appears, but this is not always the case, so explaining the size change can help our readers understand the text better.
Displays it
🔢 Add the number of times the word appeared
Differences in size and color can lead to errors in interpretation, so adding the number of times the term has repeated makes it easier to get an accurate picture of its importance.
✍🏽 Use only one type of word. It is not usually advisable to mix verbs with nouns or adjectives, as their meanings vary and lead to confusion.
🌀 Check that the words in your cloud make sense and, if necessary, eliminate empty terms such as articles or determiners.
3 tools to create your word cloud
We propose some tools to create tag clouds that we like the most and do not require downloading. We do not show them in any specific order of preference. You will have to try them and select the one you like the most.
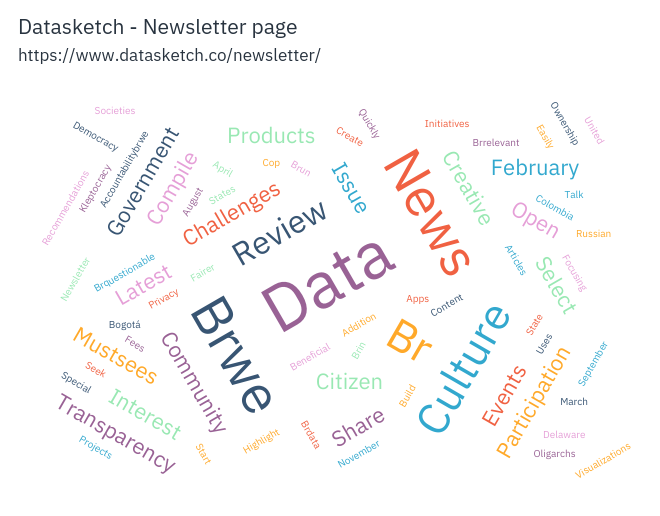
Words cloud
Words cloud is one of the easiest tools from Datasketch. It’s free, and you only need to register. It allows you to create word clouds from sample texts, copy and paste, upload a file (doc/txt/pdf) or use a URL. Moreover, you can work in different languages. The options to customize your visualization are extensive. Among them, you can choose the shape, the color palette, the slant of the words, remove common words, or the font you want to use.
WordItOut
WordItOut identifies the most frequently occurring words and highlights them. It is pretty simple and allows some customization.
Word Art
Word Art allows you to customize your word clouds with a wide range of image templates. If you are looking for originality in your clouds, this is probably a good option. It also allows you to add the word list directly in the tool and pick the shape, font, layout, and style.