


Punk culture, puzzles, travel and art - Data Culture #0
You will find a selection of relevant content related to the promotion of data culture with a summary or commentary.
Available in:
Welcome to Data Cultura
This newsletter is compiled and edited by the Datasketch team, which includes Verónica Toro, Astrid Guerrero, and Juan Pablo Marín. Below you will find a selection of relevant content related to the promotion of data culture with a summary or commentary.
#PRODUCTS
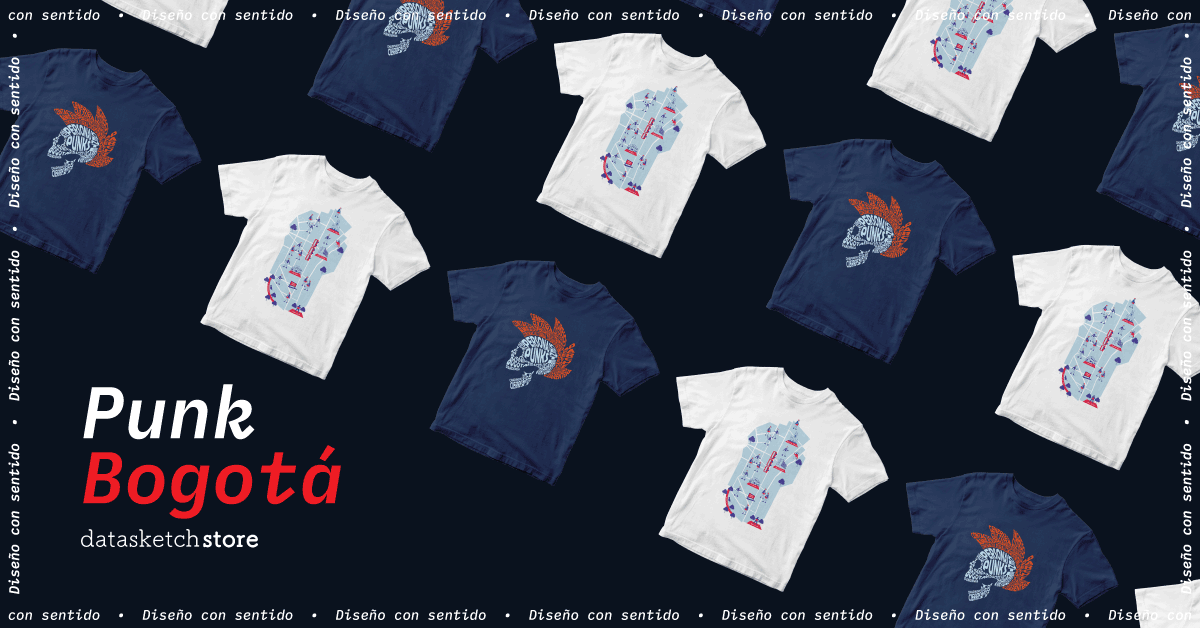
Punk nostalgia in Bogota
Punk fans in Bogota experienced, like everyone else, the impact of COVID-19 on their culture. According to the article “El golpe al punk y a otras movidas underground con los cierres por la pandemia” by La Silla Vacía, the effects went beyond the economic aspect. Researchers from the Universidad Javeriana were able to identify the social and political impacts that underground culture has faced. Based on the article, Datasketch, with the support of the local mayor’s office and the Es Cultura Local grant for the Chapinero district, devised a way to show this research in two designs that highlight the feeling for the closure of spaces related to this musical genre. The first design is a cartographic proposal that locates the most characteristic areas of the Bogota punk circuit. In contrast, the second is a design composed of a cloud of words used by the managers and more than 167 people who usually visit the cultural spaces in the interviews. You can learn more about this proposal about punk culture in Bogota here: https://co.datasketch.store/collections/destacados/products/camiseta-punks-not-dead
Puzzles, light, and open culture
Dutch artist and data visualization designer Nadieh Bremer has created a beautiful puzzle whose structure lights up multiple ways each time a piece fits into place. The visual elements thus become an incentive that allows puzzle lovers to connect even more with the physical object. Nadieh’s professional trajectory lets us see how through art and design, we can combine multiple worlds. The story of this project, called NOVA, was highlighted by Gizmodo in an article where you can read the detail of how it was made using open hardware and software components. Check out: Puzzle Rewards You With a Light Show for Every Solved Piece and
http://fab.academany.org/2021/labs/waag/students/nadieh-bremer/final-project/

#EVENTS
LabsRurales: emergency for education systems in rural areas
Between July 9 and 20, the activities of the LabsRurales: Plataforma Bogotá - Medialab Prado residency, coordinated by Juan David Reina-Rozo, will occur. These activities are based on the idea that it is necessary to understand the forms of learning that emerge in rural areas as forms parallel to formal education systems.
The aim is to prototype a web platform with a mapping of initiatives and the creation and pedagogical tools in rural areas in Spain. Some activities will be a visit to initiatives in the Spanish rural environment, the Dialogue: “rurality (s) in the city.” and a virtual dialogue between rural initiatives in Latin America.
If you are interested, you can find the schedule and registration links at Activities around the Residency ‘LabsRurales: emergence for rural education systems’.
ODI Summit 2021
The Open Data Institute, a non-profit organization whose mission is to work with businesses and governments to build an open and trusted data ecosystem, will hold its “DATA PEOPLE” Summit on November 2, 2021, between 09:00 and 19:00 (CET) virtually. There will be more than 40 panels, talks, roundtables, and immersive experiences, such as artwork and interactive games.
The topics to be addressed at the summit are: How people can have more of a voice in collecting and sharing data; The skills and tools needed to understand how data is used and wasted; How companies using data to establish more open and trusting relationships; The ways artists are investigating the use of data to foster conversations about the kind of future we want to create; What was learned about managing a global crisis through understanding people’s health and behavioral data.
You can buy your tickets at: https://www.eventbrite.co.uk/e/odi-summit-2021-data-people-tickets-154807855463
#PRIZE
STARTS Prize: 2021 Winners
STARTS is a €20,000 prize organized by Waag, Ars Electronica, and BOZAR as part of the European Commission’s S+T+ARTS initiative, which focuses on innovation at the nexus of science, technology, and the arts. The STARTS 2021 award winners were:
In the category of innovative collaboration: Remix El Barrio, an exhibition that proposes a place of learning that promotes and enables new practices based on neo-crafts with food waste.
In the category of artistic exploration: Oceans in Transformation, a research project seeks to connect new forms of visibility and understanding of the ocean brought by science, culture, and art.
You can watch the press conference where the winners were announced at Press Conference: STARTS Prize - the winners of the STARTS Prize 2021
#VIRTUAL-EXHIBITION
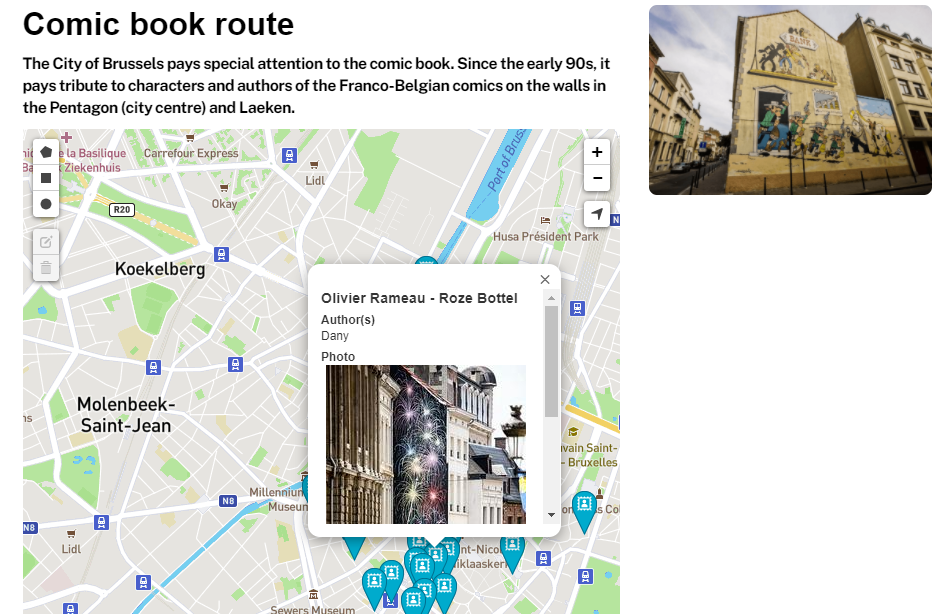
The Brussels Comic book route.
Since the early 1990s in Brussels, the capital of Belgium, various artists have paid tribute to Franco-Belgian comic book characters and authors on the walls and walls of the city center and Laeken. The city government has created a virtual exhibition using Opendatasoft, through which anyone can navigate the map of the city and see the works in their actual location. Access the collection at: https://www.brussels.be/comic-book-route
#WEBINAR
I'm locked in spreadsheets & PDFs, let me out!
The Publications Office of the European Union regularly provides a space on its YouTube channel where various data-related professionals offer masterclasses on their work. Rob Fry, a statistician, was the latest guest in these lectures, passionate about using data visualizations to uncover hidden information and stories in rich and complex datasets.
Fry leads a team of data visualization specialists at the UK Office for National Statistics, working in collaboration with journalists, designers, statisticians, and economists, to make data and information easy to understand. In the webinar, he talked about the team’s journey since its inception as a multidisciplinary group. Their approach and strategies, the collaborating way they work, reviewed the different projects they have embarked on and reflected on the next steps. You can watch the recording at: https://youtu.be/P5LJGdmRzD0
#TRAVEL
Traveling in times of COVID-19
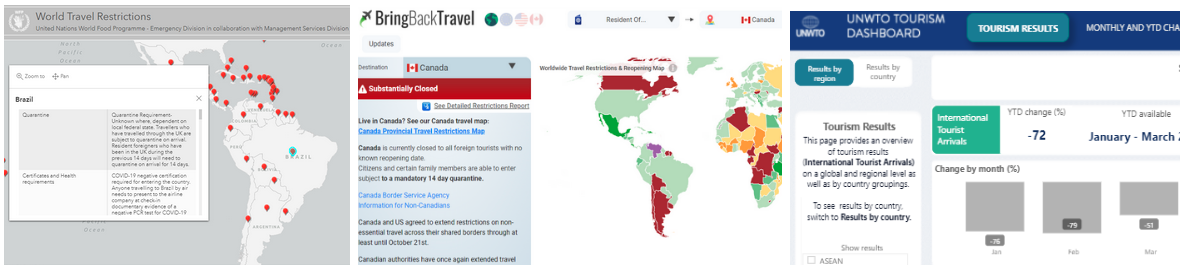
July and August are the months for traveling par excellence. However, restrictions due to the pandemic and the expansion of the Delta variant in many countries make it difficult to choose a safe place to spend your vacation, especially if the destination is international. That’s why we want to show you three data-driven tools that can help you plan your travels.
- The Humanitarian Data Exchange portal: you will find a world map with information on the restrictions in force when entering any country in the world.
- BringBackTravel: although similar to the previous one, this platform allows you to select the restrictions you will encounter depending not only on the country of destination but also on your country of origin.
- The UNWTO Platform compiles country, regional and global data on the impact of COVID-19 on tourism, its economic impact, and the most vulnerable destinations. You will be able to get an idea of what the effect has been in the place you intend to travel to, know the best destinations and which ones have the greatest affluence.
#RESEARCH
SySTEM 2020.
On June 30, the results of the SySTEM 2020 project, an investigation into non-formal and informal STEAM (science, technology, engineering, art, and mathematics) learning, were released. The final publication shares policy recommendations and methods for making science learning more accessible to students of all backgrounds. You can read the paper at: https://system2020.education/resources/system-2020s-findings-and-recommendations/
#DATASKETCH
We have created a physical and virtual conversation space to invite relevant people from the data ecosystem to talk about their work and research. In addition, we invite you to relive all our talks on our Youtube channel.
Algorithmic Art Exhibitions
This year we launched our algorithmic art gallery in Bogotá. We have already made several exhibitions. Here is a short sample of our favorite pieces. Go to this post to see our summary of our exhibitions: Algorithmic art and culture exhibitions.
‘Alternating Multilinear Shapes’ by Giacomo Miceli
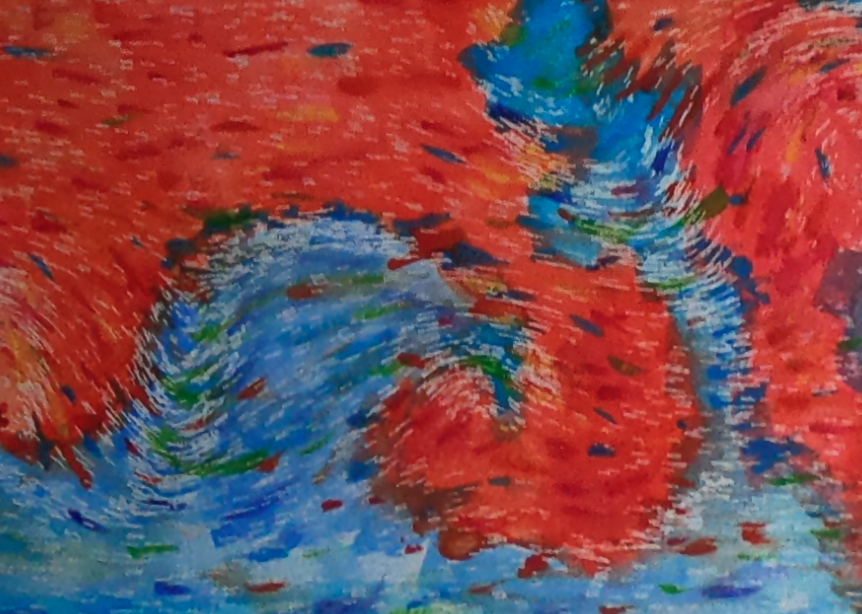
It is a close-up view of one of his works: “Flow Study”. The white is the absence of color, an effect of the self-discovery process created by applying watercolors over wax marks in a pattern created by fluid simulation algorithms.
'Paso Bajo' by Alejandro Londoño.
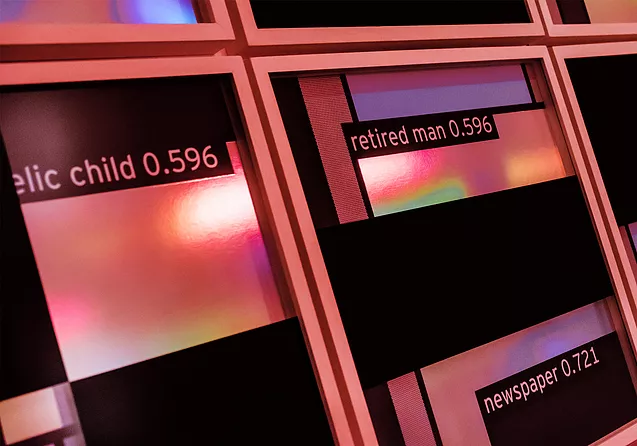
A critique of artificial intelligence algorithms and how facial recognition can lead computers to make misguided and often dangerous assumptions about our human condition. The paintings show the textual predictions of an algorithm on iconic photos, which are arranged in geometric acrylic patterns that refer to the “Haar features” one of the flagship papers of a face detection algorithm.
Conversations at the house
We have created a physical and virtual conversation space where we invite relevant people from the data ecosystem to talk about their work and research. We invite you to relive all our talks on our Youtube channel. The latest ones are:
- The challenges of science outreach from self-management with Ciencia Tropical (ES) https://www.youtube.com/watch?v=zjT88yFOJ0k
- Planteamientos Magazine Launch Panel (ES) https://www.youtube.com/watch?v=wNtopk0Zgnw
In addition, we would like to highlight:
Sobremesa digital: the data of José Asunción Silva's posthumous work by Clementina Grillo
Sobremesa digital is based on collecting data from José Asunción Silva’s posthumous work, De sobremesa, where information about decorative art, furniture, jewelry, costumes, and multiple instruments is translated from text to image through a digital process. In this talk, Clementina Grillo tells us about the process of obtaining. a digital visualization of the data obtained from Silva’s novel and the importance of exploring the narrative space in work.
Events at the Datasketch House: Digital Tabletop by Clementina (ES)
Multidisciplinary Universes: telling stories with data by Oliver Morales Agiss
We talked with Oliver, founder of MORLANmx and editor at La Data, about the importance of diversity of opinions and the creation of multidisciplinary teams to be able to tell good stories with data, and how this improves communication in the media and makes it possible to understand the movements of society and citizenship.
Events at Datasketch House: Multidisciplinary Universes by Oliver Morales Agiss (ES)
That's all for now!
If you do not remember me or do not remember Datasketch, we have your email directly in our contact list, and we think this topic may be relevant for you.
Here I tell you how I organized the entire contact database to send you this email. Maybe you will find relevant tips for your work.
We have other newsletters you may find relevant: