


Bitcoin, tessellations and data coats - Data Culture #01
A selection of relevant content such as events, articles, calls for papers and products that interact with the information, including links and a summary or commentary.
Available in:
![]()
This newsletter is compiled and edited by Datasketch’s Data Culture team, which includes Verónica Toro, Astrid Guerrero, and Juan Pablo Marín. In it, you will find a selection of relevant content such as events, articles, calls for papers, and products that interact with the information, including links and a summary or commentary.
We hope you like it! If you have any content recommendations, please reply to this email. If you think someone you know might be interested, send it to them, they can subscribe by clicking on the link.
#PRODUCTS
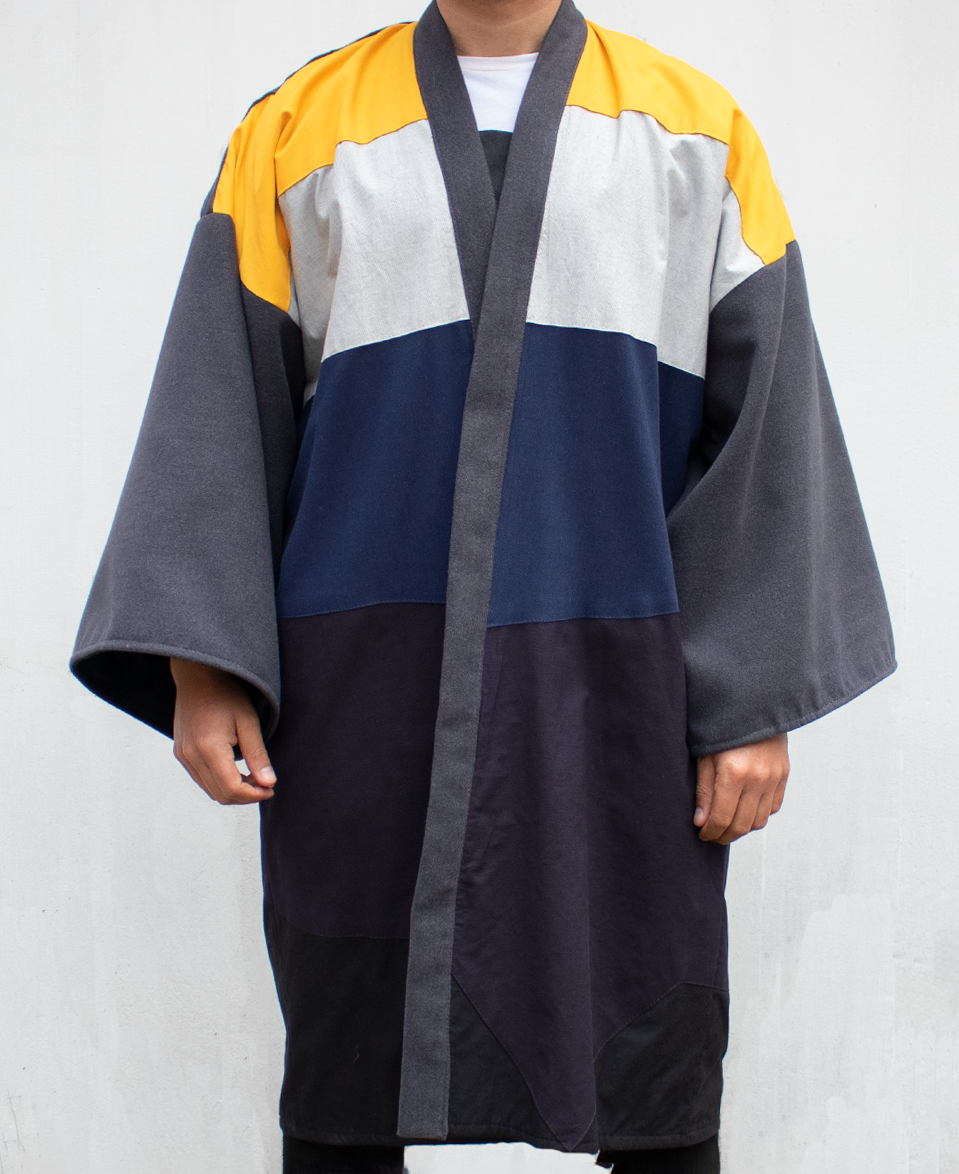
Coat temperature Bogotá \\\[-4 ... 24.8]^14.9
If there is something characteristic of Bogota is its unpredictable weather. Those of us who live in this city are used to experiencing a wide variety of temperatures and weather conditions throughout the same day. Cold at dawn, piercing sunshine at midday, rainy afternoons, and freezing nights. However, the climatic sensation that most defines the city is cold, despite climate change that has undoubtedly modified the city’s temperature.
The sensation of temperature is a highly subjective matter. For some, the city is not that cold, and others feel it is. At this point, the records of weather stations are relevant to have an accurate reading of reality. These numbers indicate that the average monthly temperature in a year varies between -4 and 24.8 degrees, the average temperature being 14.9 degrees. Is this cold or hot? Each inhabitant will have a reading on this from their own experience.
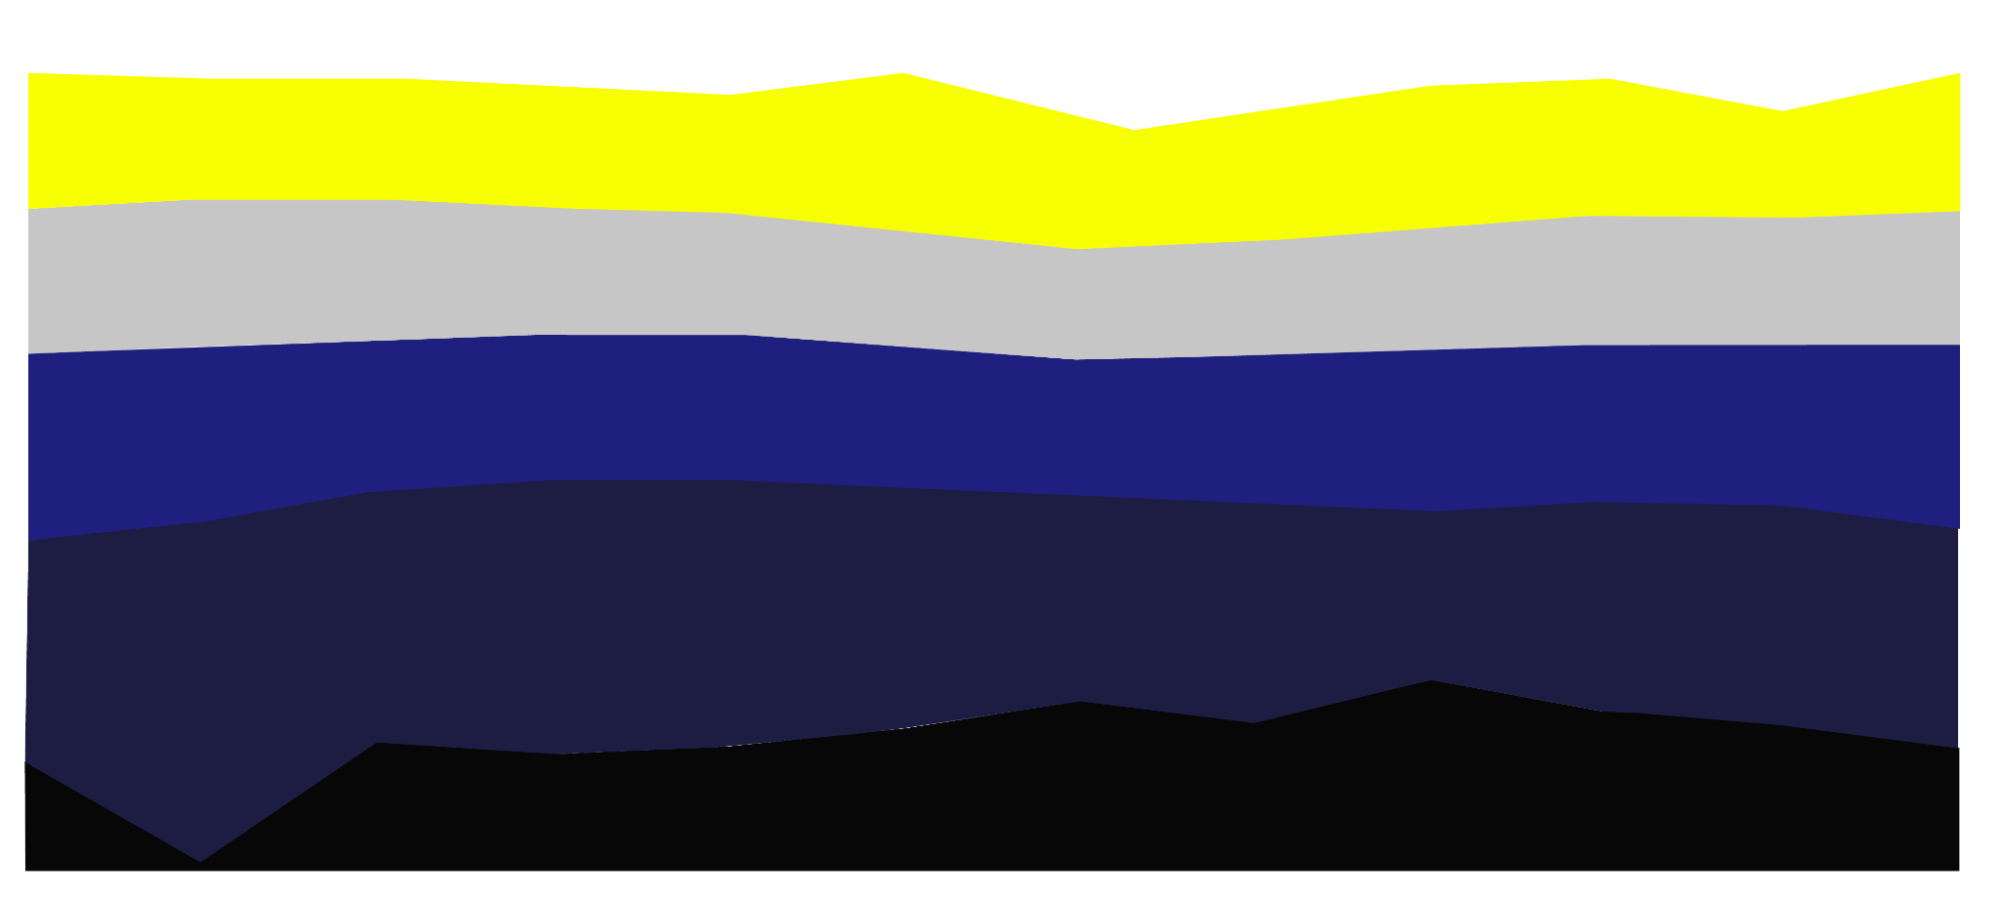
[-4 … 24.8]^14.9 is a wearable visualization of this data. In the piece are encoded different measurements in colored stripes. The minimum, average and maximum temperatures of a year are transformed into a coat with which we can take shelter from the city’s cold.
You can learn more about this proposal at https://co.datasketch.store/products/abrigo-temperatura-bogota-4-24-8-14-9 (es)
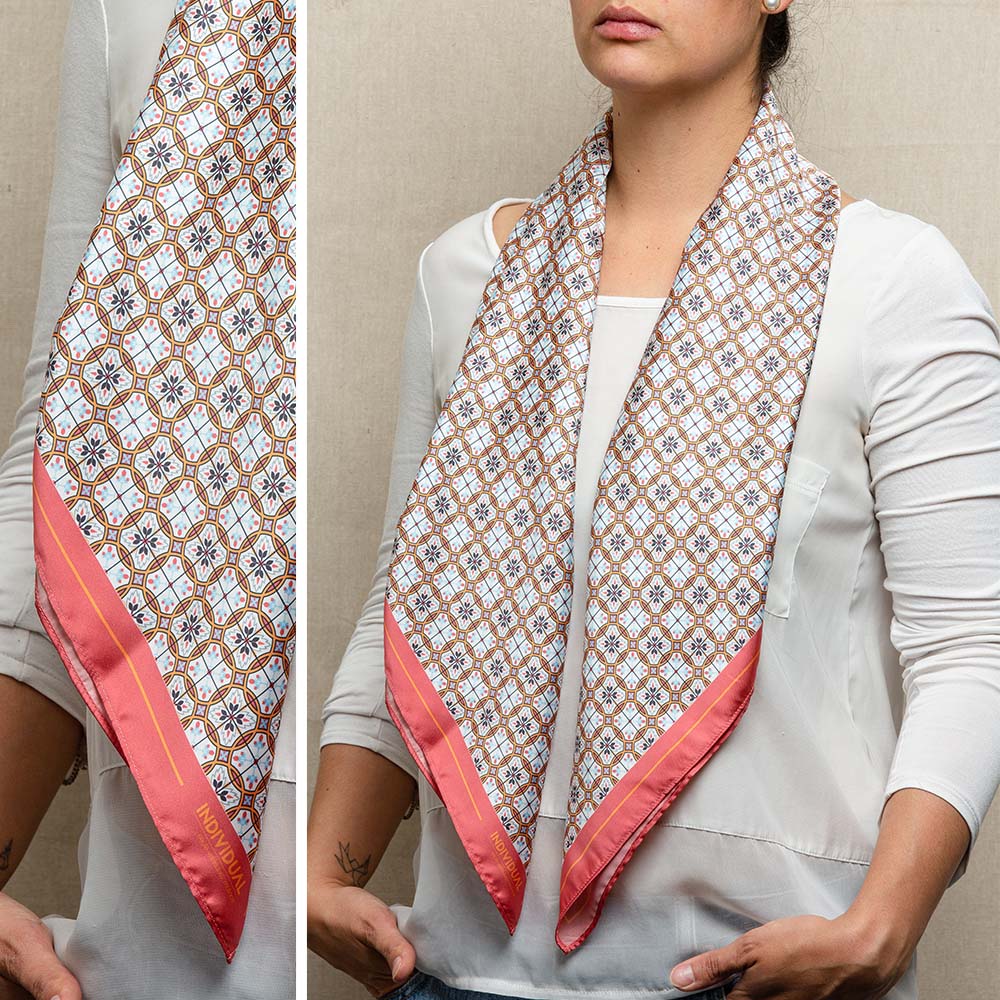
Individual scarves
INDIVIDUAL is a design brand that uses tile patterns from different parts of Colombia and around the world to create pañoletas. The inspiration of the floors is not only for the admiration of its beauty but also for not taking for granted that walking and stepping hard is something that everyone can do. In addition, they want to remember the importance of being in the present and enjoy all the stories. This product is 100% made by Colombian hands and in ecological materials.
You can see the designs at https://co.datasketch.store/products/individual-panoletas
#TALK
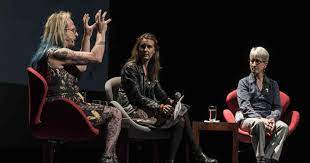
A public conversation with Brigitte Baptiste and Donna Haraway, moderated by Kristina Lyons.
CK:WEB, the experimental audiovisual and radio station of the Art, Science and Technology Line of Idartes, in 2019 talked with the director of the Humboldt Institute Brigitte Baptiste and the biologist and philosopher of science Donna Haraway where they talked about how environmental conflicts shape and are shaped by the way we relate to the world.
Relive the talk here: https://ckweb.gov.co/donna
#ARTICLE
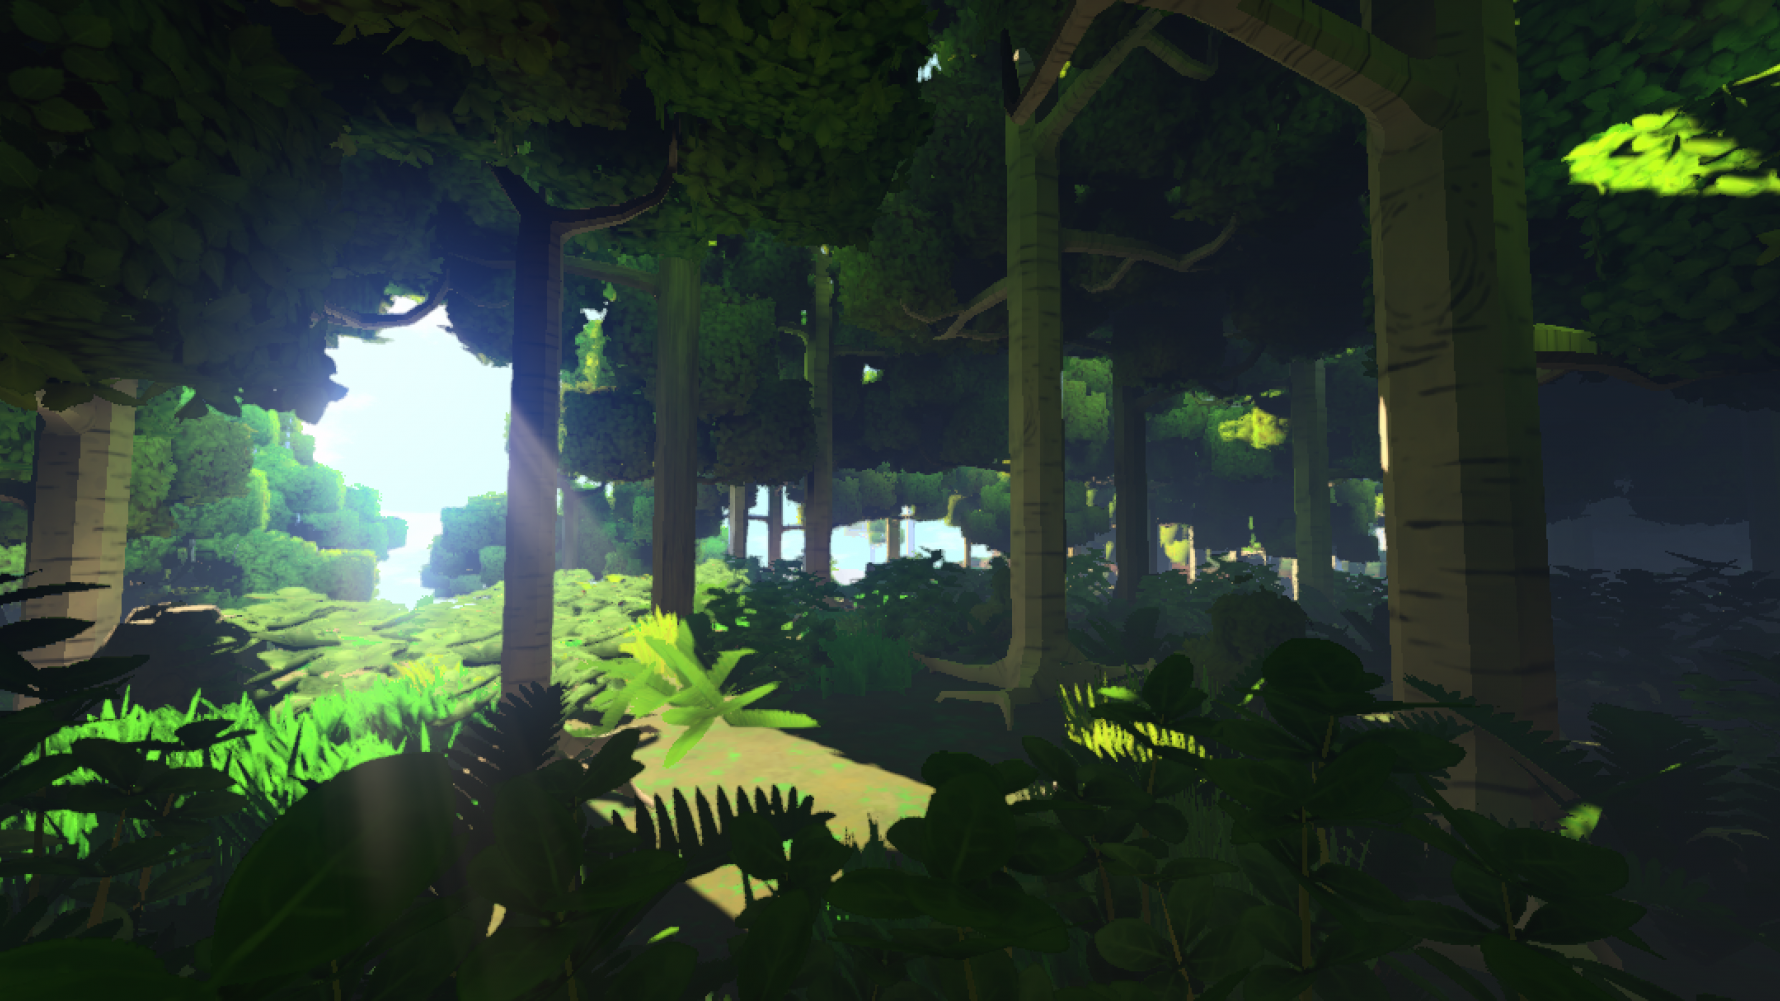
Playing Nature: Ecology in Video Games (2019)
Alenda Y. Chang, a writer, scholar, and contributor to Artist Worlds, focuses on the relationship between video games, the natural world, and the role that play can play in addressing the climate emergency. In this interview with Serpentine, she talks about her book and her willingness to establish scientific, artistic, and ethical principles around video games and their relationship with nature.
In her book, Playing Nature, she examines the overlap between our ecological crisis and video games, arguing that video games should be understood as part of a cultural response to the growing environmental crisis. The book seeds conversations around key concepts and terms in ecological science.
The author suggests several ways to rethink existing game taxonomies and theories of agency while revealing striking fundamental similarities between the game and scientific work.
T-REX HI 2150 NO INTERNET
John Barragán is a physicist at the Universidad Pedagógica de Colombia, a lover of citizen science, school, and Wikipedia. In this article, he invites us to play T-Rex dinosaur, the game that appears on the screens of laptops, cell phones, and tablets when there is no internet connection. There John challenges you to think about the need to identify the digital divide with present figures of the disconnection and undertake the search for this information that perhaps increased the number of people not connected to the Internet.
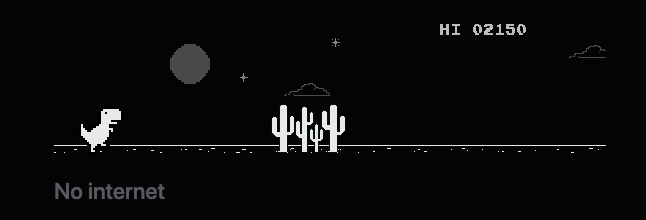
Also, if your purpose is to have the highest score in this game, John proposes the guidelines to hack the T-REX code and never die. You can follow the instructions here: https://www.unocero.com/como-se-hace/como-hackear-el-juego-de-dinosaurio-chrome/
#Fashion
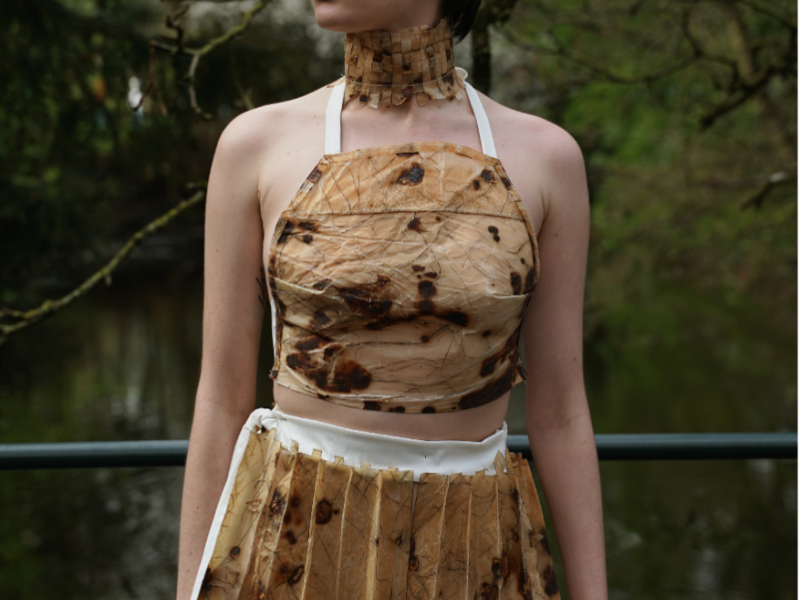
Artichoke Textiles: Rebecca van Caem at Fabricademy
Fabricademy is an interdisciplinary course that focuses on the development of new technologies applied in the textile industry. They have a wide range of approaches and applications. Participants learn to develop their products and conceptual designs using digital fabrication techniques in biotechnology and craftsmanship.
On this occasion, designer Rebecca van Caem, a 2020 Fabricademy graduate, created textiles from food waste such as artichokes and kombucha. In this link, you can learn more about her proposal.
#Laboratory
Smart Citizens Lab
This laboratory, based in Amsterdam, defends one of the current values of public research: Citizen Science. Where they conceive society as a community of researchers and citizen scientists, understanding by citizen science that all people have a place as research subjects, those citizens who help to think how to build the foundations of the “smart city.”
They appropriate the internet of things to map and improve the social environments they are subject to and where technology can strengthen the positions of citizens concerning governments and businesses.
In Smart Citizens Lab, members are provided with open source tools and learn how to measure their environment by interrogating data. By strengthening their knowledge and collecting data, citizens occupy a stronger position in the conversation, providing them with tools to improve their quality of life.
You can follow the group and join this community on meetup.
#Convocation
A critique of technology from the performing arts.
In this space, which will take place from September 1 to 18, participants will be able to question those objects we use in our daily lives through their deconstruction and reconstruction. They will also be able to subvert the use of the pieces and turn them into other elements, blurring the gap between designers and users, two poles that are initially considered opposites. The definition of technology will be put on the table, and its uses and disuses will be criticized through artistic creation.
Register here:
#WEBINAR
The Event Remix: How to Drive Hybrid Engagement
In this hybrid event, you will learn how to combine physical and digital elements to create a shared experience, whether attendees are in person or virtually in different parts of the world.
You will explore the components of a hybrid event and learn how to create immersive and interactive experiences that engage both physical and digital audiences.
You can register at this link: https://www.on24.com/the-event-remix-how-to-drive-hybrid-engagement/?utm_source=upcoming
#EVENT
International Data Week is postponed to 2022.
The third edition of International Data Week will take place in Seoul from June 20-23, 2022, under the theme “Data to improve our world.” The event, which was scheduled for November this year, has been delayed to ensure the participation and safety of attendees.
It is an international event organized by the Committee on Data (CODATA) and the World Data System (WDS) of the International Science Council (ISC), and the Research Data Alliance (RDA). It brings together data scientists, researchers, leaders, entrepreneurs, policymakers, and data stewards worldwide to explore how best to exploit the data revolution to improve science and society through discovery and innovation. All information can be found at: https://internationaldataweek.org/
#HOME-DATASKETCH
At Datasketch, we have created a physical and virtual conversation space to invite relevant people from the data ecosystem to talk to us about their work and research. In addition, we invite you to relive all our talks on our Youtube channel.
Bitcoin, a long-term savings technology
The way people invest their money is transforming by opening up fields in technology for an investment in their future. For this reason, Datasketch held a talk with Guillermo Valencia, where we talked about how technology drives people to approach finances. In addition, how this information enables a long-term savings plan, as it organizes consumption stimuli and generates a better future planning.
If you want to know more about this talk, we invite you to review our blog with the summary of this event: https://www.datasketch.co/blog/open-government/bitcoin-a-technology-for-long-term-financial-saving/
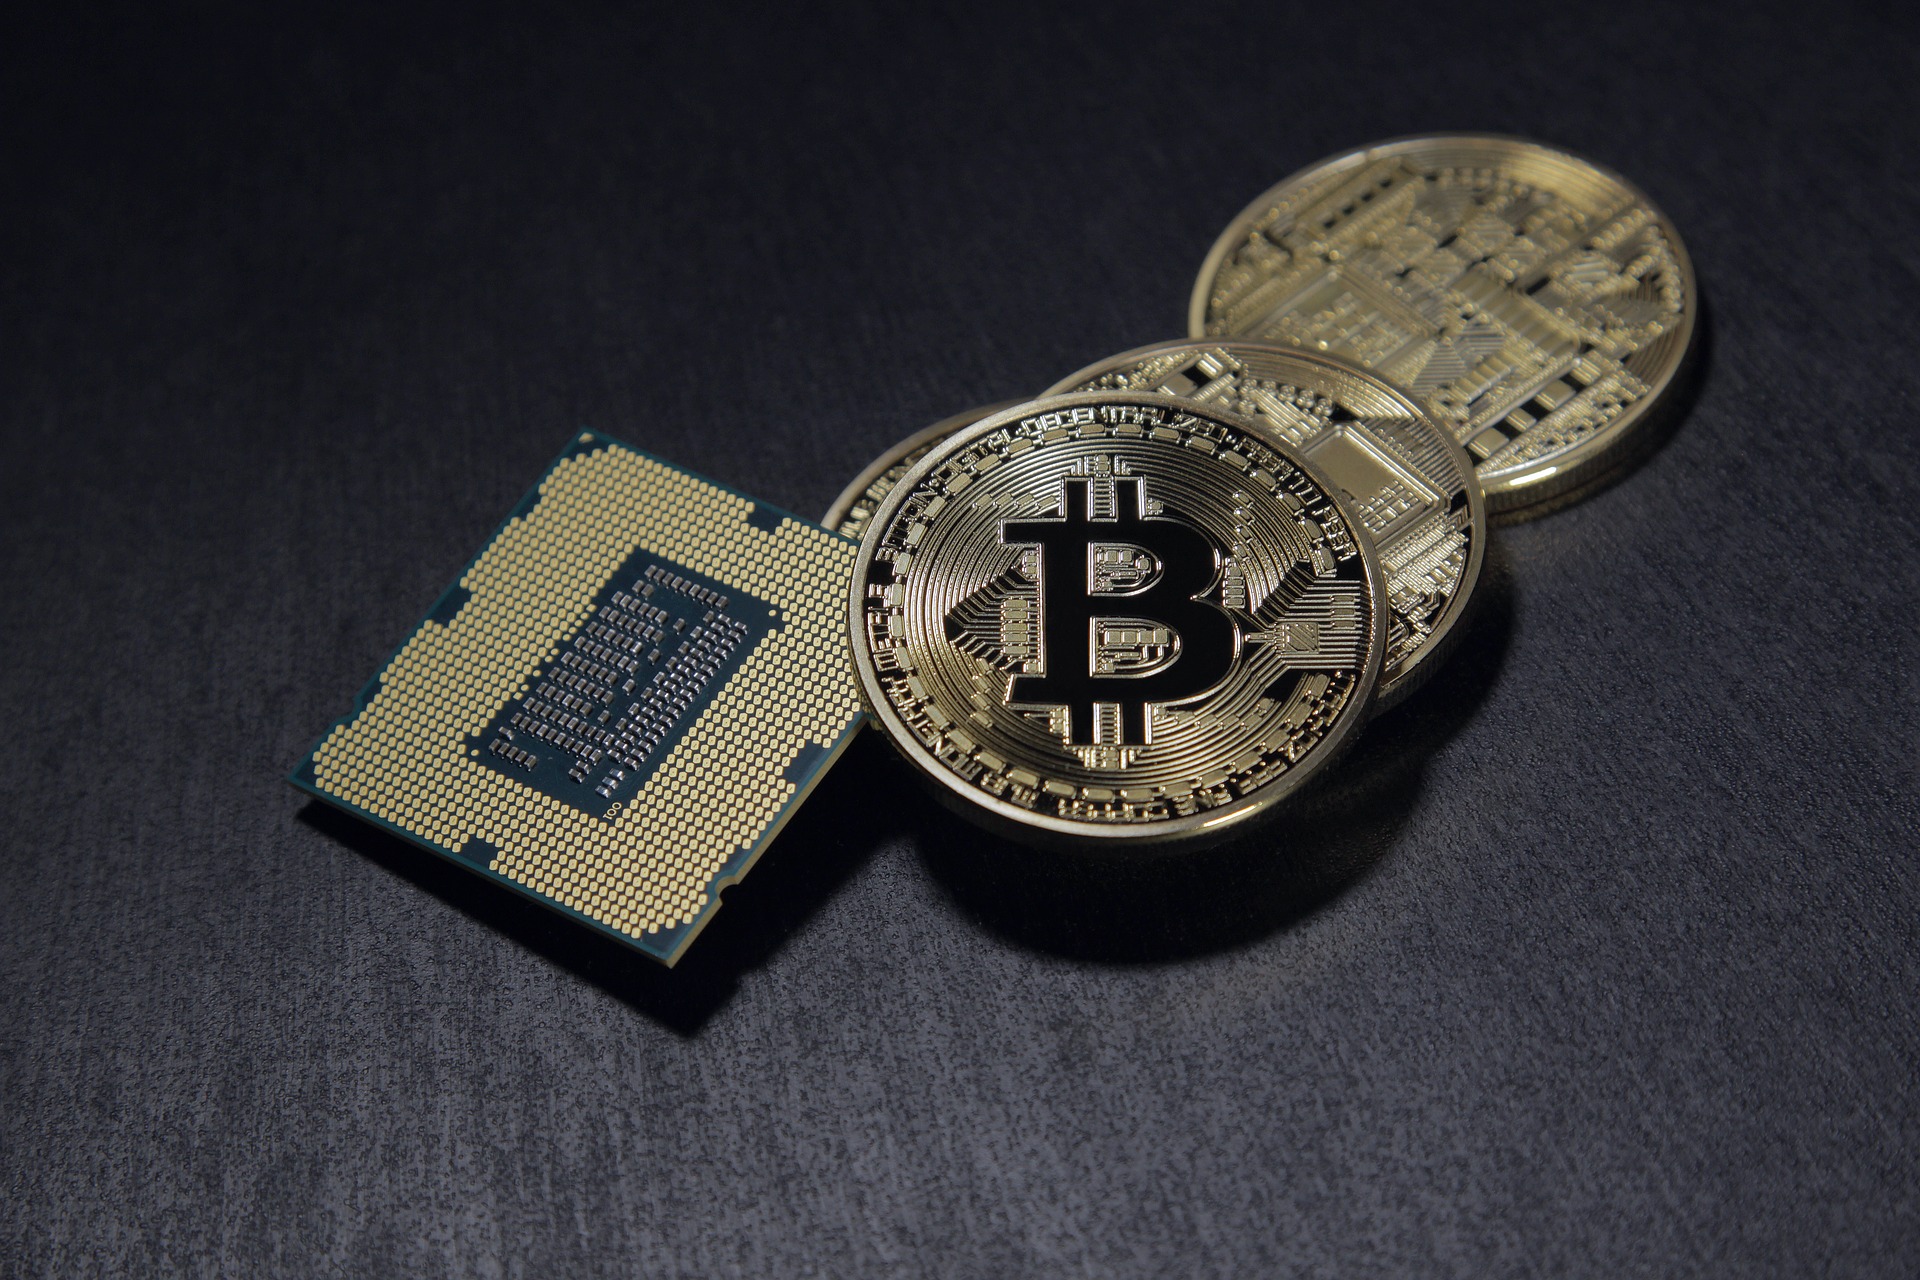 Image by Benjamin Nelan from Pixabay
Literature and data with Clementina Grillo
La sobremesa digital is a project based on collecting data from José Asunción Silva’s posthumous work, De sobremesa, where information about decorative art, furniture, jewelry, costumes, and multiple instruments is translated from text to image through a digital process. In this event, Clementina Grillo tells us about the process of obtaining a digital visualization of the data obtained from Silva’s novel and the importance of exploring the narrative space in work.
You can learn more about this event on our blog or relive the recording of this talk on our Youtube channel.

#DATA-VISUALIZATION
Diversity Explorer: Boston, Households, Entropy
“How can we see and understand human diversity in new and more profound ways? What can analysis of the household units that make up a city such as Boston tell us about the hidden dynamics of diversity?”
To address these questions, the project (in beta) ”Diversity Explorer” by The Co-Laboratory for Data Impact for the Boston Research Center at Northeastern University examines linguistic and racial variations in Boston households, using census microdata, and visualizes the data using metaphors. You can find all the info at https://pmcruz.com/div-exp/

censusAmericans
Still talking about census data in the United States, we want to introduce censusAmericans, a Twitter bot created by the Fivethirtyeight data lab.
Census data often look at the big picture, but there are people inside those top-line numbers. Looking at some of the fields in those data sets can give insight into their lives. That’s why they created a Twitter bot that looks for details in the data. The bot, which has been running since 2015, tweets short biographies based on the data provided to the U.S. Census Bureau. Using a small Python program, the bot reconstitutes the numbers and codes in the data into mini-narratives. Once an hour, it converts a row of data into a real person.
https://fivethirtyeight.com/features/introducing-censusamericans-a-twitter-bot-for-america/