


Mental Health and Cyberfeminism - Data Culture #12
Mona Chalabi's illustrations, research on depression,data plus on cyberfeminism and "Datos y Guaros"
Available in:
We share this week’s must-sees: we start with Mona Chalabi’s illustrations of Jeff Bezos' wealth. We continue with two pieces of research on depression that open the discussion on mental health in pandemic times. You will find the team’s four recommendations and the data plus on cyberfeminism. Also, if you are in Bogotá, we invite you to the “Datos y Guaros” on Elections in Colombia.
Newsletters | Blog | Subscribe
Mona Chalabi and the data on the true wealth of billionaires
In the New York Times Magazine special, “9 Ways to Imagine Jeff Bezos' Wealth”, data journalist and illustrator Mona Chalabi creatively shows in a simple way what the Amazon founder’s wealth represents to the rest of humanity.
Starting with figures on the internet about Jeff Bezos' wealth, Mona deep dives into financial reports and scant documentation. The result is nine ways in which we could materialize his ULTRA-wealth, estimated at $172 billion.

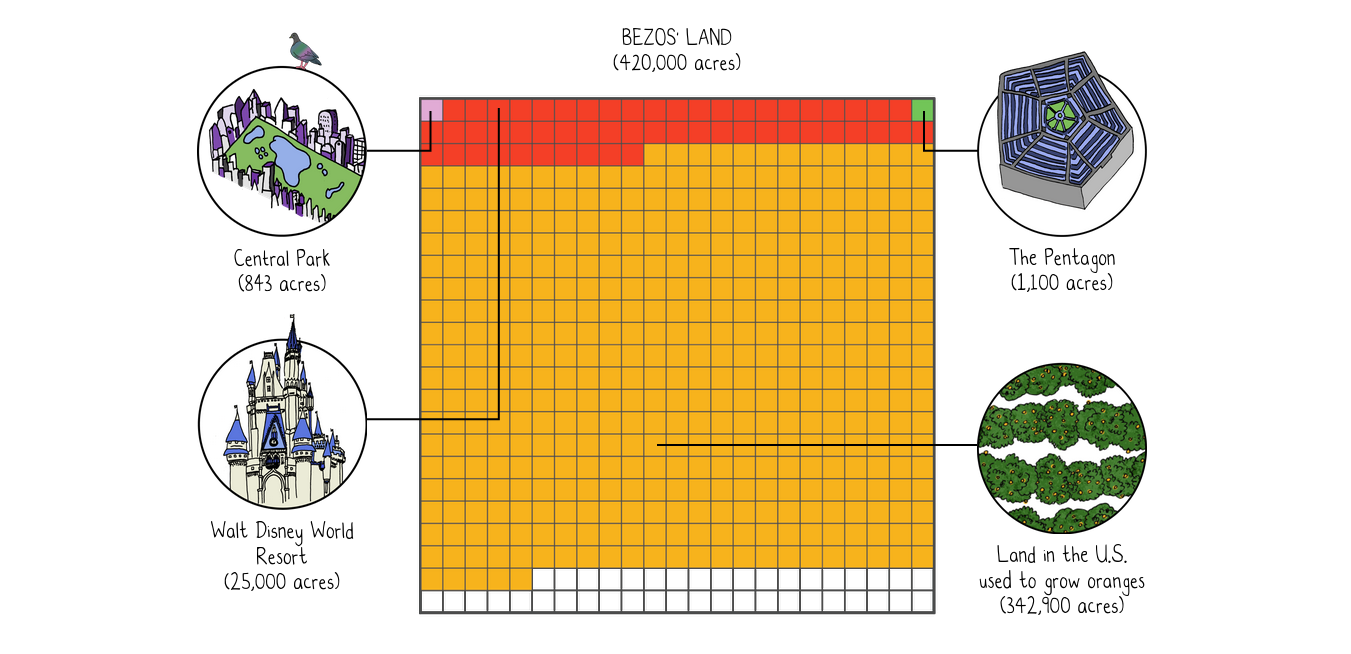
Source: 9 Ways to Imagine Jeff Bezos' Wealth - The New York Times
Depression
Depression affects the way we think, feel and act. This is why the questions “At what age do people experience depression for the first time?” and “Why are American teens so sad?” can give us insight into the factors and situations that make depression a constant or an intermittent occurrence in the people who inhabit it.
This chart shows the age of onset of depression based on the meta-analysis by Marco Solmi and colleagues.
🧐 Read more.
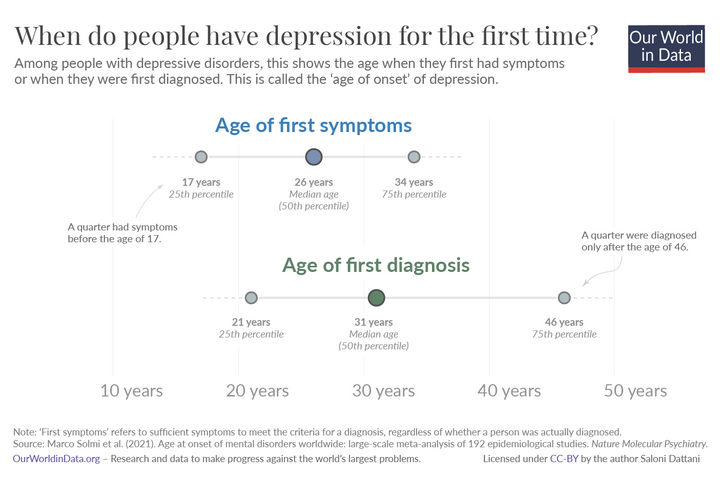
Source: At what age do people experience depression for the first time? - Our World in Data
Dereck Thompson identifies four factors: social networks, current low socialization, the increasingly stressful world, and modern parenting strategies as factors that influence the constant feeling of sadness in young people.
🧐 Read more.
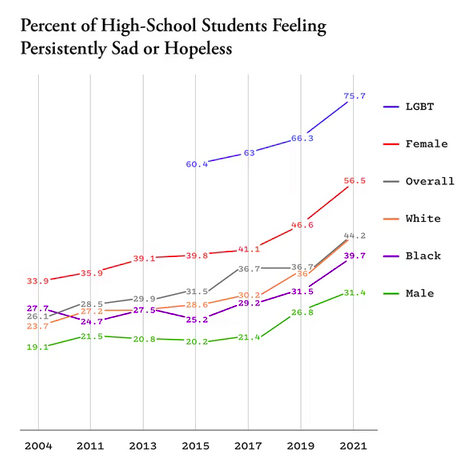
Source: Why American Teens Are So Sad - The Atlantic
If you want to go deeper, we invite you to follow The Depression Project.
Visualization
Writing without words
Stefanie Posavec used the sentence length, themes, parts of speech, sentence rhythm, punctuation, and underlying structure of Jack Kerouac’s On the Road to visualize her “literary organism” and “sentence drawing” approaches. Without recourse to words, Stefanie shows how the work and the writing are structurally organized.
The emotional connection to a topic and the process of collecting and visualizing data in an artisanal way allow dissecting the process of data visualization production. This artist and designer’s big bet: the handcrafted and manual element is evident in the creation of information graphics.
🧐 Read more.
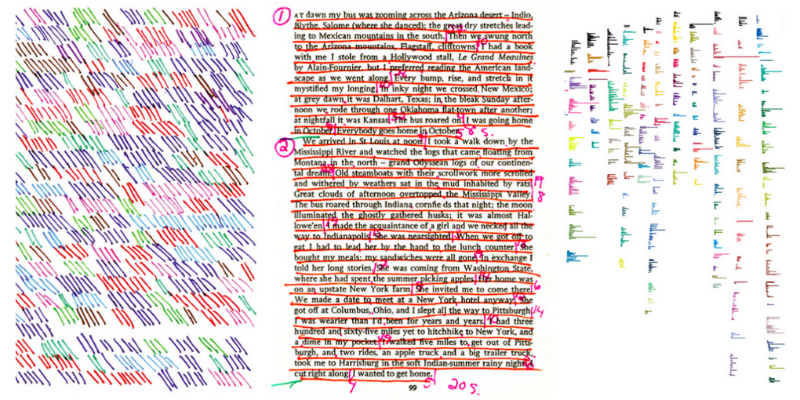
Source: Writing Without Words — Stefanie Posavec
Things we like
Here, you will find events, visualizations, exhibitions, exercises, images, and GIFs that intertwine data, culture, and social movements.
- 📚 Gender-neutral names on the rise | Georgios Karamanis. In this visualization, Georgios Karamanis shows us how the number of gender-neutral names has changed from 1880 to 2010. He looked at 168,000 names and plotted the proportion of girls and boys who received them. Some were only used for girls, others only for boys, but some names began to be used indistinctly over time.
- 🎙 📻 In with the old: How radio is beating streaming at its own game | New Statesman. Although it would seem that radio is an old technology from the 19th century, 9 out of 10 people still listen to it in the UK. Radio has adapted to digital changes, and almost 60% of radio stations are listened to in digital formats. This article explores this radio phenomenon.
- 🚗 The vehicles of James Bond | Baryon Design. One of the most persistent characters in action movies is James Bond, secret agent 007. In this visualization, we see the history of this character’s vehicles in his movies since 1962.
- 🏁 🏳️🌈 The Past and Future of Flag Emoji 🏁 | Jennifer Daniel. Emojis, or graphic characters, were introduced into the ASCII code from its inception, seeking to include not only letter characters. As time has passed, and the code has been updated, new characters have been included, including characters with colors (at its inception, ASCII was only black and white). With the inclusion of colors, it was possible to expand to various characters, such as hearts and flags. This article tells the history of these flag emojis, and their use nowadays. Although they are the least used, they are evident in their meaning and have not come into existence without controversy, for example, including pride flags.
Datos y Guaros
Datos y Guaros is an informal meeting between journalists, info activists, researchers, and the data community who gather to share experiences, projects, and learn over guaros, that is, aguardiente (an alcoholic beverage drunk in several Latin American countries).
In this space, we promote open data use in research and organizations, create collaborative networks between different actors, meet new friends and listen to new proposals in informal spaces.
This Thursday, April 28th, we have a new edition, and we will talk about Elections in Colombia during pandemic times. In 2022 Colombia faces new elections. The outlook is not very encouraging: the exacerbated increase in poverty, homicides of social leaders, and territories in dispute by illegal armed groups that have paralyzed communities and plunged into violence. We want to share and explore solutions that propose to make good decisions for these elections.
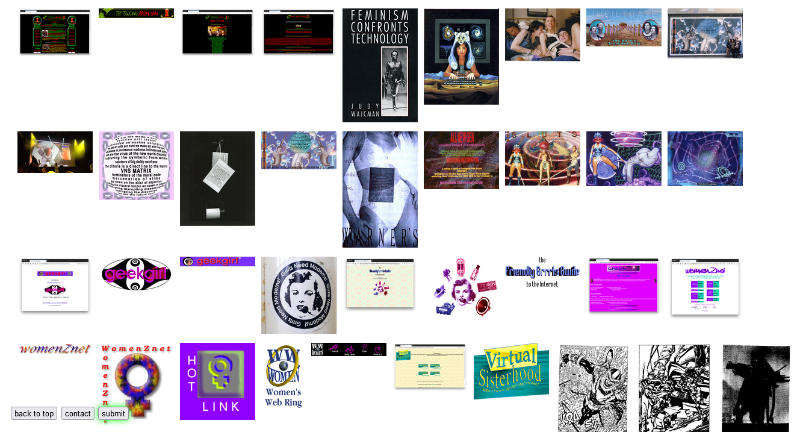
Data plus: Cyberfeminism Index
Our team recommends Cyberfeminism Index. It is a digital collection that tries to gather as many cyberfeminist projects, sources, and references as possible in one place. The project is always in progress and open to new material to incorporate. The site is searchable and simple to navigate. You can search by text, collections, or image gallery.
This large repository aims not to reduce cyberfeminism to the intersection between women and technology and its issues. On the contrary, it is about the diffusion and transmission of technology and its multiple subjects.
Read more (button)
Source: Cyberfeminism Index
That's all for now
Subscribe to our newsletter! You will receive our content directly in your inbox.
Verónica and Edda wrote this issue. Learn more about data journalism, data culture, and open government in our blog and newsletters.