Visual Mythology and History - Data Culture #16
We select visual formats on Aztec gods and World War I, resources on weather and measurements in our top 5, and talk about the upcoming "Datos y Pola".
Available in:

We are Datasketch. In this newsletter, we spread the word about the initiatives that inspire us to continue growing as a data-driven cultural space.
We share with you this week’s must-sees: we select visual formats about the Aztec gods and the First World War, the five things we love about time and its measurements, and we point out the Datos y Pola in our events agenda.
The little-known Aztec Pantheon
Gwendal Uguen and Luc Guillemot show us the incredible hundred Aztec gods in The Pudding visual guide. When some of us only distinguished Quetzalcoatl and Tlaloc, this special brings us the complexity of the Aztec Pantheon. Certain gods shared abilities and domains, and specialists have difficulty yet identifying the symbols and attributes in Aztec iconography.
They used sources, including ancient manuscripts such as the Codex Borgia, Bernardino de Sahagún’s Historia general de las cosas de Nueva España, and scholarly articles.

Source: A Visual Guide to the Aztec Pantheon.
Five things we like
- 👯♂️ Culture & Trends Report 2022 | YouTube. YouTube trends site functions as a public repository of data, explanations of current trends, and statistics that help understand the full spectrum of content.
- 🧔🏽 How is Felix Today? | Felix Krause. This personal project makes Felix’s life available to Internet users compiled in a single database, which records his travels, his physical condition, his social life, and the surrounding weather, among other things.
- ⌛ How Much Time We Spend Alone and With Others | Nathan Yau - FlowingData. The American Time Use Survey data-based graph shows a simulated day for 100 people.
- 🗓️ Calendar Collective is a living archive of diverse and alternative calendars. This project is an ongoing research to collect, catalog, and publish a collection of little-known calendars.
- 🎨 Data Culture is a collaborative space for reflection and experimentation on research methods and tools in art and culture.
Casa Datasketch
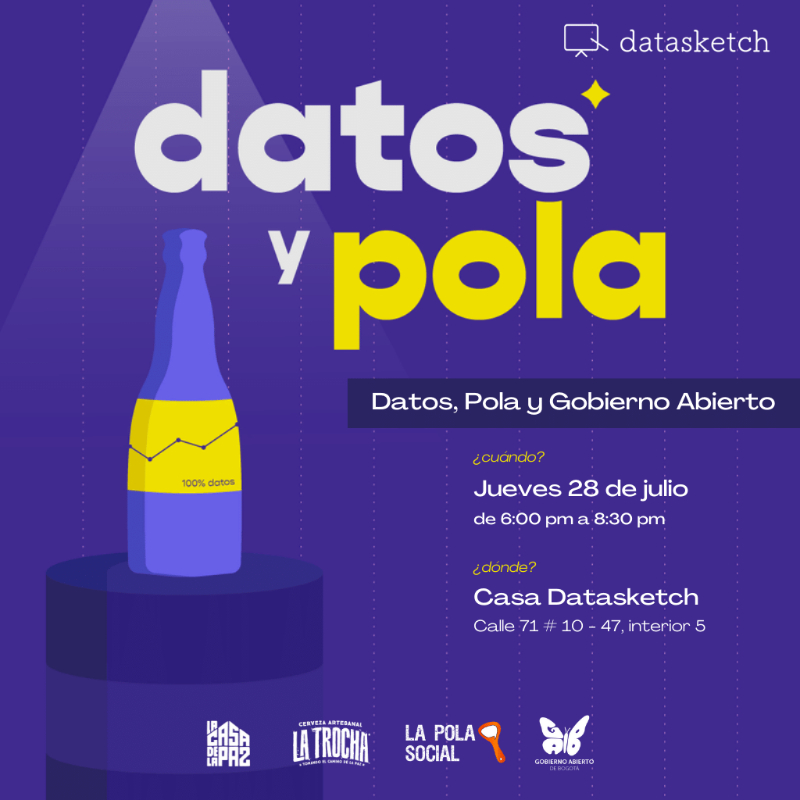
This Thursday, July 28, we have the launch of Datos, Pola y Gobierno Abierto. Datasketch, La Pola Social, and the GAB (Gobierno Abierto de Bogotá) are teaming up to create a meeting between citizens, public entities, and citizen observatories. The conversation will revolve around good practices, tools, and processes for trust and city building.
🏡 Datasketch House
🗓️ 6:00 to 8:30 p. m.

Source: Datasketch
Data plus
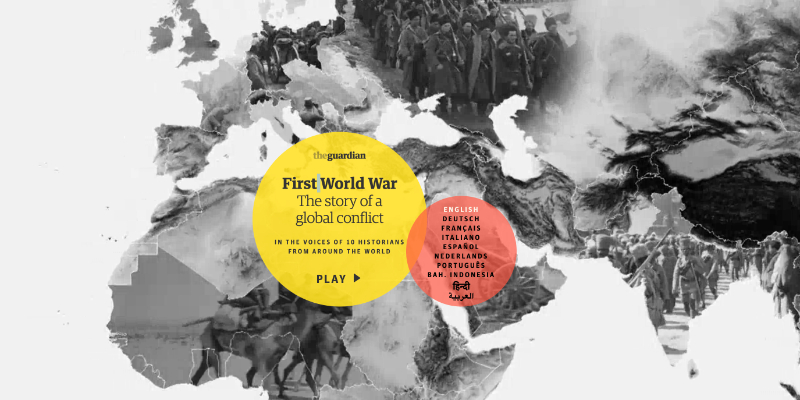
Our team recommends First World War: A History of a Global Conflict.
In this interactive documentary, ten historians from around the world tell the story of the First World War. This enlightening global guide uses interactive maps, little-known archival footage, and never-before-seen scenes.
The documentary lasts approximately thirty minutes and explores this event from very different angles and perspectives on the commonly told history of the wars. The best part is that it is available in several languages.

Source: The Guardian


