


Visual Language - Datasketch Data Culture #09
We share with you the must-sees of data culture. February 2022.
Available in:
![]()
This is the first edition of our Data Culture newsletter in 2022 ❤️🔥. This week, we share the must-sees of data culture. We start with NFTS from Ethiopia, which highlights African identity through hair. We continue with a visualization of how we make circles in different parts of the world and tell you about our Spinning Futures project. In the end, you’ll find the team’s recommendations and our Data Plus.
If you have been forwarded this newsletter and like it, you can subscribe here. You can read the Spanish version here. If you like data journalism, open government, and culture check out our blog and newsletters.
Strong Hair
The way we wear our hair says more than we think. In Ethiopia, a hairstyle can indicate a symbol of social, civil, or economic status. It is also a way of innovation.
The STRONG HAIR project is a collection of 100 360° portraits that recover and highlight the visual language exposed in the Ethiopian way of combing one’s hair. These, in turn, are elements of memory and identity of African hair protected using Blockchain.

Source: STRONG HAIR : 027 : ፳፯
In Colombia, specifically in San Basilio de Palenque, Bolivar, the hairstyles of the Raizal community are a living testimony of their past and a symbol of freedom. Braids and hairstyles for the Palenqueros have an ancestral meaning.
Women weaved the history of escape of enslaved people and their way to freedom in these. It represents a visual means of resistance since the women used their hairstyles to capture the routes and roads, delimiting the maps they had to travel to escape from slavery.
Visualization
Circles
We believe that all circles are the same, an immutable and perfect mathematical formula that we replicate. However, visualizations made by Quartz in 2017 from the analysis of more than 100,000 drawings made by people on the Quick, Draw! App show cultural differences in the way we draw a circle.
Do you start your circle from top to bottom, clockwise or counterclockwise? This information may give clues about your origin.
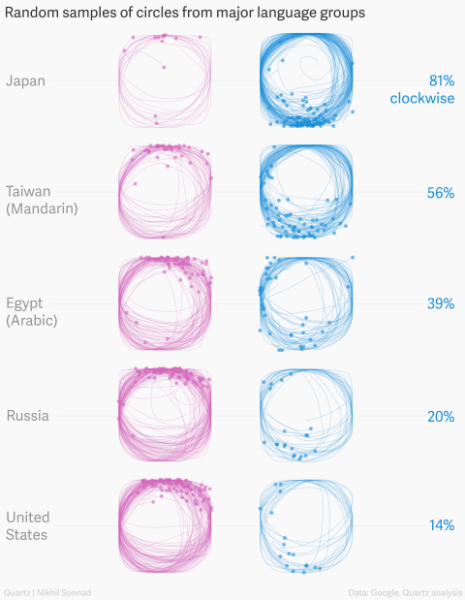
Source: How do you draw a circle?
Datasketch
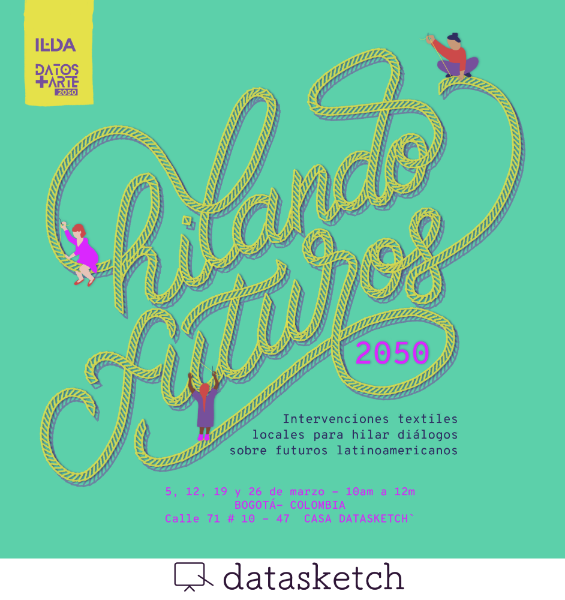
Spinning Futures 2050
Spinning Futures is a series of meetings that will be held simultaneously in four Latin American cities throughout March: Mexico City, by the Agujas Combativas collective; Montevideo, Uruguay, by Nuevo Reino; in San José, Costa Rica, by ILDA, and in Bogota, Colombia, by Datasketch. The meetings will be in person.
The proposal aims to understand embroidery and its different techniques as another form of knowledge to interact with data. Understanding how the ways of contact and interaction with different materialities and textures are configured in practice allows us to build our knowledge that makes everyday life. In the end, we will hold an exhibition at Casa Datasketch. There we will expose to the public our embroideries of the future. Visit us!
Our Team Recommendations
In this space, you will find recommendations selected by the girls of our team. Here you will find events, visualizations, exhibitions, exercises, images, gifs that intertwine data, culture, and social movements.
Culture and data
- 🎬 Data can be beautiful. The audiovisual production of this short film highlights the types of data visualizations and how they have accompanied us throughout time.
- 💌 Modern World: A Prehistory of Social Media. If you want to know how the internet became what it is today, this book will give you an overview.
- 🎶 Generative Music This is NFT of generative music (with beats) that you can include in your browser and will allow you to jam for hours.
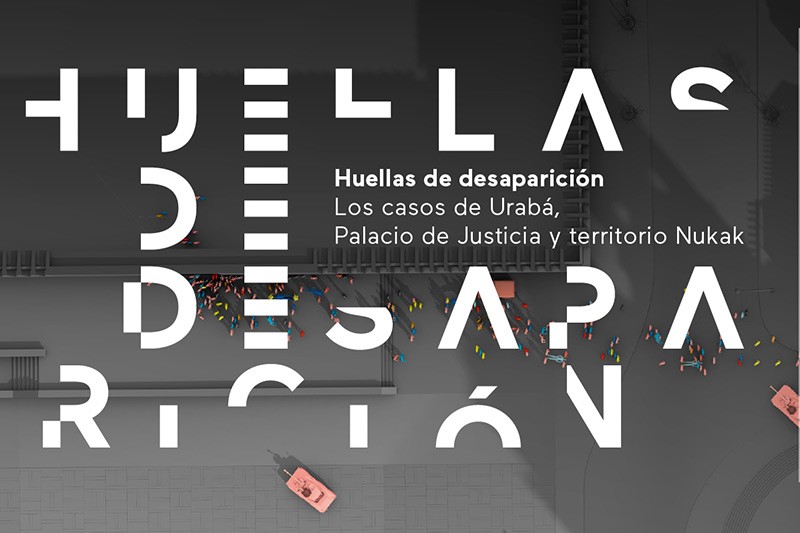
Data Plus: Disappearing Footprints Exhibition
Traces of Disappearance is an investigation of the Truth Commission and Forensic Architecture that clarifies human rights violations in Colombia, such as dispossession, disappearance, and massacres. Knowing the facts and their effects is a way to understand the current history of the countries.
This exhibition reveals spatial and technological research methodologies, generating audiovisual results and reconstructing these events minute by minute in 3D formats. This exhibition will be at the Museo de Arte Miguel Urrutia (MAMU) in Bogota until April 2022.
See you next time!
Edda and Vero wrote this newsletter. If you have been forwarded it and like it, you can subscribe here.
Twitter | Facebook | Instagram | LinkedIn | Blog | Newsletters