Data Journalism at its Best - Data Journalism #0
You’ll find the latest data journalism trends, information about events, and tools that can be helpful in your journalistic labors, including links and a summary of the information.
Available in:
¡Welcome to Data Journalism!
This newsletter is compiled and edited by the Datasketch Data Journalism team, Sasha Muñoz, Juliana Galvis, Laura Ortiz, and Juan Pablo Marín Díaz . You’ll find the latest data journalism trends, information about events, and tools that can be helpful in your journalistic labors, including links and a summary of the information.
#AWARDS
Discover the best data journalism content in the world: Sigma Awards 2021
From the 545 projects that entered the competition for the Sigma Awards 2021, which rewards the best projects in data journalism, the jury selected 13 winners and awarded 7 citations to outstanding works from around the world. Some of the award winners include Kloop’s research on femicide in Kyrgyzstan “I Would Have Killed Her Anyway” and “At the epicenter,” by Agência Lupa and Google News Initiative, which gives visibility to those killed by COVID-19 in Brazil.
You can see the other projects and the complete list of winners here.
#PODCAST
The Data Journalism Podcast by Alberto Cairo & Simon Rogers
The Datajournalist & Data Editor of Google News Lab, Simon Rogers, and Alberto Cairo, Professor of Visual Journalism at the School of Communication at the University of Miami (UM), have launched a new podcast on data journalism. In the first episode, they introduce listeners to a world of data definitions to help them understand upcoming chapters and a review of the Sigma Awards 2021 with some of the jurors. This first podcast lasts 53 minutes, and you can listen to it at: https://anchor.fm/ddjpodcast
#VISUALIZATION
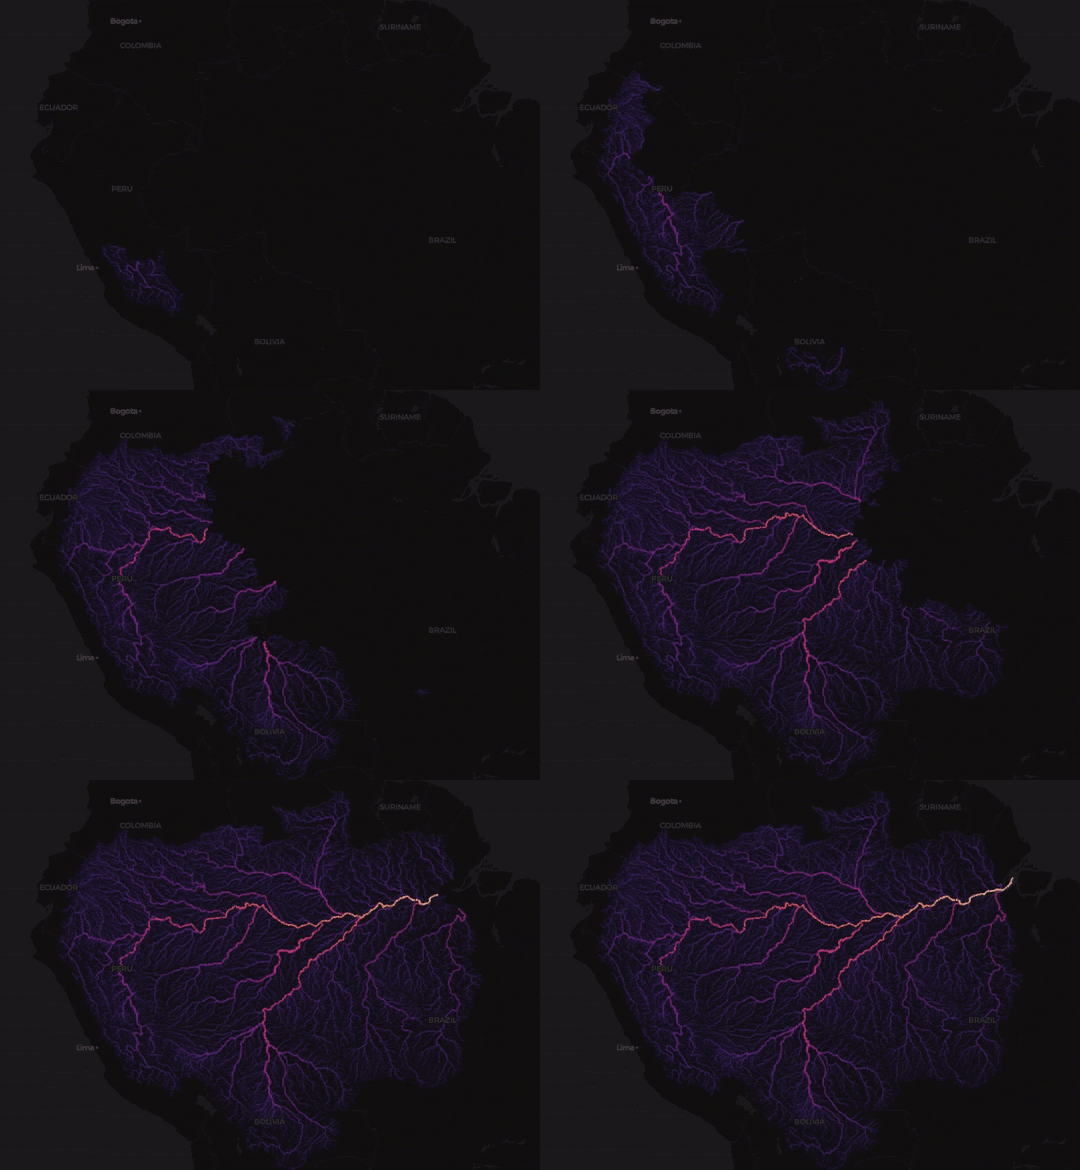
Visualizations to fight the water crisis.
On the occasion of the celebration of “World Water Day,” which aims to raise awareness about the global water crisis and the need to seek measures to address it, hi.stamen.com created multiple visualizations that focus on the flow and structure of rivers around the world. For this, they used the World Wildlife Fund’s HydroRIVERS database. You can see below the one of the Amazon River. Rivers animate starting at the most upstream location to where they empty into an ocean or inland basin. The river lines are colored by the total distance traveled; brightest have traveled furthest and darkest having traveled the least. If you want to see more animations and access the whole story, visit: https://hi.stamen.com/rivers-de92f8b462ac

#BOOKS
Privacy is Power, Why and How You Should Take Back Control of Your Data by author Carissa Véliz
As you read this, someone is stealing your data. The author of this book goes through such everyday activities as checking your cell phone in the morning, carrying a step counter watch everywhere you go, to analyze everything from how organizations sell your personal information about your genetic data to large companies, to the use of facial recognition technology by governments and cell phones. So, If you want to learn how to protect your personal information and educate yourself about the new threats from digital thieves in the age of web storage, this book is for you. You can find it on Amazon.
#RESEARCH
Cuestión Pública made available a list of arrested people during the National Strike in Colombia
The independent media published the 1106 people captured by the Police during the National Strike in Colombia between April 28 and May 25. The press obtained access to the list through a petition for guardianship and contempt of court, with the legal support of the organization El Veinte. The media published the information so that those captured can be located and initiate an investigation to help find the people who have been reported missing in the striking framework. The list is available at: https://cuestionpublica.com/personas-capturadas-cali-paro-nacional-2021/.
#OUR BLOG
In the information age and in pandemic times, there is no shortage of data. On the contrary, readers have more and more resources and sources of information to choose from. For this reason, journalists and content creators are looking for ways to attract users. We take a look at how two international media agencies have used charts and graphs to reach more audiences in the context of the pandemic. More charts, more readers: visual stories of the coronavirus.
5 tools for transcribing interviews and audios
How long did it take you to transcribe an interview or audio the last time you did it? We present 5 tools that will be extremely handy to speed up your journalistic labor when it comes to transcribing interviews and audios for your investigations. 5 tools to transcribe interviews and audios.
Recommended article: Do journalists "hide behind" sources when they use numbers in the news?
We review the article that Mark Coddington and Seth Lewis published in NiemanLab, which analyzes the latest study by B.T. Lawson, professor at Loughborough University, on the importance of checking and contrasting data in journalism, regardless of the source. Do journalists “hide behind” sources when they use numbers in the news?
That's all for now!
If you do not remember me or do not remember Datasketch, we have your email directly in our contact list, and we think this topic may be relevant for you. Here I tell you how I organized the entire contact database to send you this email; maybe you will find relevant tips for your work.
If you have been forwarded this email because someone thinks you might like it and you want to subscribe to the newsletter, you can do it here: subscribe!
We have other newsletters you may find relevant:


