


Open Data Day - Data Journalism #10
Let's celebrate the Open Data Day!!
Available in:
This week, we celebrate Open Data Day with events and lots of content demonstrating open data’s importance.
If someone has forwarded you this newsletter, and you like it, you can subscribe here.
#OpenDataDay
On March 5, Open Data Day (ODD) is celebrated with events worldwide. It is an opportunity to showcase its benefits and encourage the adoption of public policies.
On the #OpenDataDay platform, you can find all the events. We highlight here three that we find interesting:
- Sierra Leone: OSM Africa March Mapathon: Map Sierra Leone. This event is the ninth OpenStreetMap Africa mapping event per country to contribute to a complete and detailed map of the entire continent.
- Barcelona, Spain: Celebrating International #OpenDataDay! It is one of the cities with more official events proposed in the ODD (6), and the Generalitat de Catalunya organizes all of them. It is a proposal from the open government to promote data of this type.
- LATAM and Spain (online): Calles De Las Mujeres Workshop. Geochicas runs this project, which geolocates streets named after women in Latin America, Spain, and Italy. In doing so, they show the gender representation gap in cities.
ODD at Casa Datasketch
Our proposal for this day is the talk “Futurology and prospection” (es) guided by Cami Bohórquez in the framework of the #HilandoFuturos (es) project.
Futurology is associated with exploring the possibilities that can occur in a particular context given constraints of resources, equipment, and knowledge. It allows imagining futures that seem impossible and invites to innovate to reach them. ✍🏽 Fill out the form!
🕒 Saturday, March 5 from 14:00-16:00 h (Col).
📍🏡 Casa Datasketch - Calle 71 #10-47, Bogotá, Colombia. | Datasketch YouTube

DataViz
Data visualization to explain the war
Following the publication of the visualizations of the tension between Russia and Ukraine, we noticed that several media used the same data comparing the military strength of both countries. The difference was in their visualizations. In the article Russia and Ukraine’s military strength: same data, different visualizations, we evaluated the scope and limitations of the graphics used, including one of our own.

Source: Own visualization created with Datasketch Simple Charts app.
A selection of the best in dataviz
Our newsletter #8 on data journalism covered Andy Kirk’s curation of the best data visualizations (Visualizing Data). He published his October 2021 selection in February, which brings together 78 links. Again, we highlight Andy’s work, which is a source to learn about the people and media working on data visualization and what they are doing.
Research
What is the state of data journalism?
Between November and December 2021, DataJournalism.com surveyed more than 1,500 data journalists. The results show that the majority are in the U.S. and are more male (59%) than female (39%). They work primarily as freelancers and much less in leadership or editorial positions. About 63% of the total have less than five years of experience. This percentage may be related to the fact that they have more knowledge in journalism but less in data analysis and visualization.
Among the challenges identified are limited data quality, resources, and time. In general terms, the survey identifies working conditions and needs, which help make decisions in the profession.

Source: The State of Data Journalism | DataJournalism.com
Want to read more?
We give you a varied selection of other content that we like.
- 🩺 Acceso a la salud durante la pandemia en México: enfermedades crónicas | Serendipia
- 🤖 Europe: Analysis of the Proposal for an AI Regulation | Montreal AI Ethics Institute
- 🌳 Are climate goals compatible with reducing poverty? | The Economist
- 👁🗨 Washington Post readers identify slaveowners in Congress | Washington Post
- 📚 How to use data and AI to analyse women’s representation in news | JournalismAI
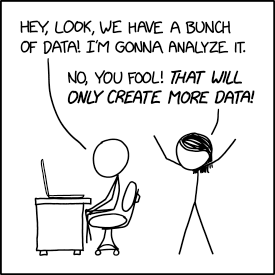
Source: Data Trap - XKCD
See you next time!
Juan Garnica, Laura T. Ortiz, and JP Marín Díaz wrote this newsletter. If someone has forwarded you this newsletter, and you like it, you can subscribe here. Check out our blog and newsletters if you like data journalism, open government, and culture.
Twitter | Facebook | Instagram | LinkedIn | Blog | Newsletters