SDGs, Digital Media, and Democracy - Data Journalism #04
6 years of SDG implementation, inclusive initiatives and tools to improve knowledge in data science. September 2021.
Available in:
Have you reached us through social networks, or have you been forwarded this newsletter and want to receive it in your email twice a month? Subscribe!
We are Nicolás Barahona, Juan Garnica, Laura Tamia Ortiz and Juan Pablo Marín, the Datasketch Data Journalism team. In this edition, we focus on two elements: increasing knowledge in data science and presenting examples of inclusive initiatives.
If you want to read the previous newsletters, you will find them at Datasketch Newsletter - Data Journalism.
#SUSTAINABLE-DEVELOPMENT
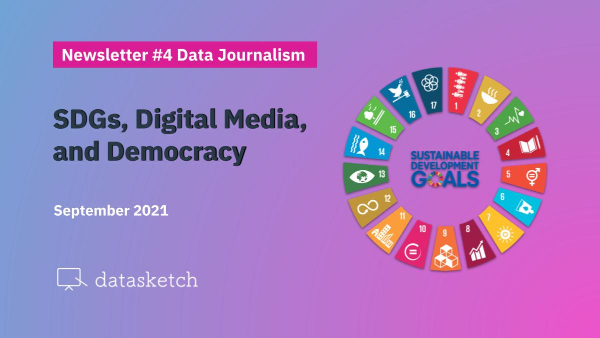
September 25 marks 6 years since the signing and adopting the 17 Sustainable Development Goals SDGs and their targets as part of the 2030 Agenda. The SDGs are a universal call to end poverty, protect the planet and ensure everyone lives in peace and prosperity.
Monitoring the SDGs
The UN has a platform and an open database that allows knowing the global progress since 2016, enabling the annual reports. Our World in Data also offers a tracking tool with visualizations of the current status of the goals globally and by country.
International Network of SDG Promoters (RIPO)
RIPO is a citizen movement that articulates efforts, actions, tools, experiences, and knowledge to promote and accompany concrete contributions to fulfill the 2030 Agenda and its SDGs.
On the occasion of its 6th anniversary, on September 25, it will organize its first international virtual meeting. The space will include opportunities for exchange, reflection, and workshops to build the “Roadmap for the Promotion of the Sustainable Development Goals.”
Register through this link.
Barriers in the use of Data for the SDGs
The Global Partnership for Sustainable Development Data has published this report as part of the Data Values Project. It identifies problems for using data to promote the SDGs. It invites the debate towards reuse from an approach of equity and inclusion, as the mere availability of data does not automatically lead to sustained use of them.
From Datasketch, we believe that this is the way forward and one of our reasons for being, so we offer tools to bring data management closer to anyone.
#EVENTS
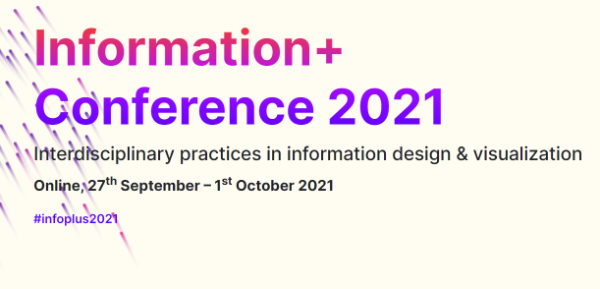
Design and visualization: Information+
Information+ brings together researchers, educators, and practitioners in information design and data visualization to discuss common issues. It aims to foster knowledge exchanges between information analysis and communication theories, practices, and pedagogies.
It will take place virtually between September 27 and October 1 via Zoom. Each day of the conference will include two sets of live conversations. You can find out more details at this link and register here.
Transparency in international aid
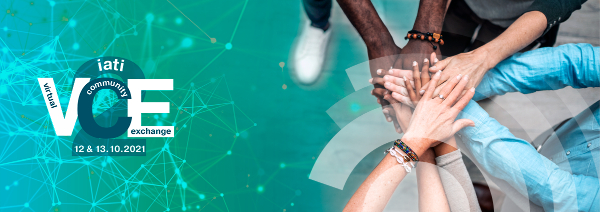
The Virtual Community Exchange is a space proposed by the International Aid Transparency Initiative (IATI) community, including people interested in open data on development and aid transparency.
The event, which will take place on October 12-13, will provide opportunities for shared learning based on practical experiences of working with IATI’s international aid information. It will have open and informal spaces to incorporate stakeholders from all levels of expertise. You can register here.
Gender Statistics
This forum will bring together multisectoral stakeholders involved with the production, financing, management, analysis, reuse, and communication of UN gender statistics.
It will address various thematic areas that drive in-depth work with gender data, and present global best practices in their management. For more details, schedule, topics, and speakers, click here.
Data for a better life
With this course, delivered by the World Bank Open Learning Campus, you will explore the 2021 World Development Report (WDR) and how can use data to advance development outcomes.
You will also learn about the principles of a new social contract for data and data governance needed to transform the lives of the poor.
It will be held between October 6 and November 14. If you are interested in more World Bank online courses, click here.
#DATA-VISUALIZATION
Design, Storytelling, and Analysis
Are you looking for inspiration for your next story? Meet the 10 finalists of the Tableau Community Iron Viz, whose winners will be revealed at the Tableau Conference 2021, which you can attend by registering before October 24.
In total, 320 visualizations were made on totally different topics, using all kinds of graphics. So if you like visualizations, this is your place.

Source: Dinushki De Livera
#NEWS
No data, no story
Carlos T. Pérez-Brito, senior specialist in social development at the World Bank, reflects in this article the need to know the problems in-depth to solve them. That means analyzing the context, who is affected, and what the variables are.
He emphasizes the importance of all populations being represented in the data, especially those that generally are not, such as the indigenous population, which represents 15 percent of the world’s extremely poor.
His vision should be familiar to any journalist in this time of increasing crises, and we seem to have no way to explain them.

Photo: Jose Gil/Shutterstock.com Via: World Bank Blog
Learn how to cover voting
Long months of elections are approaching all over the world. The development of information gathering techniques and data visualization tools make it possible to make notes that make sense of citizens' decisions.
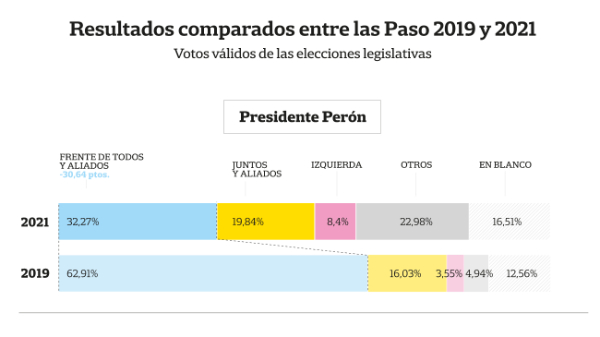
The results of the polls are only part of the story. Variables and events are waiting to come together. One way to learn how to do this is by reading this report from the Argentine newspaper La Nación, which shows the loss of the ruling party’s power in the last elections in several regions that it once dominated almost without discussion.
Uncover a virus that has not gone away
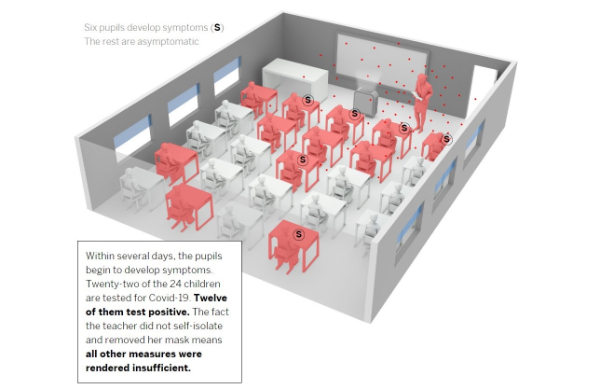
The newspaper El País, Spain, explained how one of the most mediatized coronavirus infections in the United States: an unvaccinated teacher who infected half of her elementary school students with the delta variant.
The images and interactive graphics compose a narrative that begins with the first day of contamination and ends with the national implications. The article is revealing about the need to use masks and massively apply vaccines to complement biosecurity measures.
If you want to see other examples of reporting on coronavirus through visualizations, visit our blog post.
Brainstorming for the NICAR22 conference
Investigative Reporters and Editors are beginning planning for the upcoming 2022 NICAR Conference, one of the most prominent in the field of journalism, to be held in Atlanta, USA, March 3-6.
With this form, you will share ideas, suggestions, and other comments to improve that planning until October 10.
They will also set up a mailing list so that those interested can stay up to date with the latest news about NICAR22, receiving information about speakers, sessions, travel, scholarship deadlines, and much more. So sign up here to receive those emails.
#COMMUNITY
Open Data Policy Lab's Cities Incubator
Despite Covid-19, some cities continue to build and expand an open data infrastructure and generate what is called “data innovation.”
According to the Open Data Policy Lab, a resource center that supports decision-makers using open data, such innovation is essential to energizing the economy and democracy.
The Lab offers a program to empower public intrapreneurs, of which the 10 inaugural participants have already been announced.

Strengthening journalism in Latin America
Google News Initiative Startups Lab Hispanoamérica, with the NGO SembraMedia, supports digital native, Spanish-language and independent media in Latin America that serve their communities.
This month they announced the 10 chosen to receive funding and support to boost their business model.
There were 300 applications from 18 Latin American countries. Among the winners are four Mexican media and a representative from Bolivia, Argentina, Ecuador, Venezuela, Paraguay, and Guatemala.

That's all for now!
If you want to receive this newsletter twice a month, subscribe!
Check other newsletters and content:


