


Inequality, Ethics and Resistance - Data Journalism #07
We review the most outstanding specials in data journalism. December 2021.
Available in:

We are Nicolás Barahona, Juan Garnica, Laura Tamia Ortiz and Juan Pablo Marín, Datasketch’s Data Journalism team.
This time we focus on the multiple manifestations of inequality. Its impact goes beyond the economic, affects the quality of life, and increases the consequences of crises on people.
Have you reached us through social networks, or have you been forwarded this newsletter and want to receive it in your email twice a month? Subscribe!
#INEQUALITY-AND-RESISTANCE
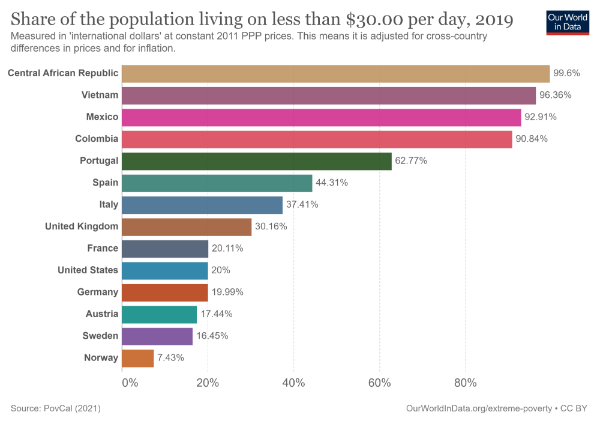
Evidencing extreme poverty to search for solutions
One of the major problems worldwide is social inequality and the stagnation of the poorest economies. In recent centuries, great progress has been made against extreme poverty, and it has become clear that economic growth is possible and that poverty can be reduced.
Today, extreme poverty is the reality for one in ten people globally. Therefore, Our World in Data presents data and research showing how this problem has evolved in the world.
In high-income countries, the poverty line is set at approximately US$30 per day, double the minimum income of a worker in Colombia. In this app, you will compare countries concerning this indicator.
Africa will become the center of the world's urban future
This multimedia special from The Washington Post tells, based on academic research and on-the-ground reporting, how African metropolises are transforming and what the demographic projections are for the continent, which by the end of the century will be home to 13 of the 20 largest urban areas in the world.
A group of more than 20 people, including journalists Max Bearak, Dylan Moriaty, and Júlia Ledur, made this report. Cartographies, spatial images, interactive visualizations, dialogue with citizens who live the diverse dynamics of the cities, and photographs make up the journalistic journey through the African coasts and the northeast of the region. It addresses migration, the struggle of foreign powers in the area, unequal growth, and catastrophes affecting vulnerable populations.
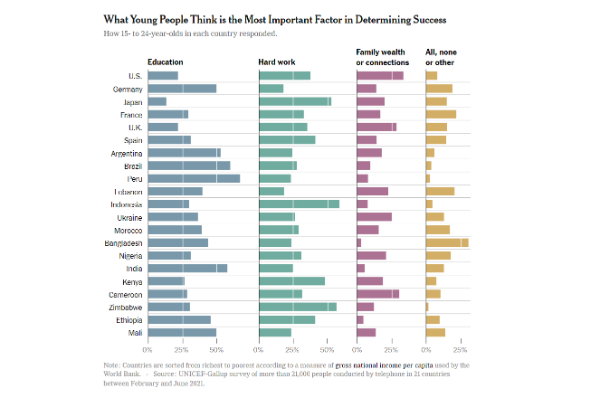
Young people are more optimistic in poorer countries
Talking about hope can be a symbolic exercise. Mentioning the term does not create the scenario or the totality of its meaning. However, we can affirm that it exists: hope is found in stories and is quantifiable.
Unicef and Gallup surveyed more than 20,000 people in 21 countries to get their views on where the world is going, intending to use that information to improve the lives of children in the short, medium, and long term.
In this regard, Claire Cain Miller and Alicia Parlapiano, journalists at The New York Times, conducted a data report. It shows the connections between the current state of economies such as the United States; the impressions of young people in Africa, Latin America, Europe, and Asia; and the factors that, according to the Unicef survey, are determining how life is understood today.
Data, stories about economic income, job opportunities, family wealth, climate change, or education are united in the text, which you can consult here.
Unequal unemployment benefits in a broken system
Bloomberg has analyzed more than 2 million applications for unemployment benefits between March 2020 and February 2021 in Georgia, USA.
One of their most striking findings is that black workers who lost their jobs during the pandemic were more likely to be denied unemployment benefits than white workers.
Shawn Donnan, Reade Pickert, Madeline Campbell, and Rachael Dottle explain the effects of this bias through three data visualizations, worker testimonials, consultation with public entities, dialogues with policymakers, and a deep dive into the multiple causes of inequality.
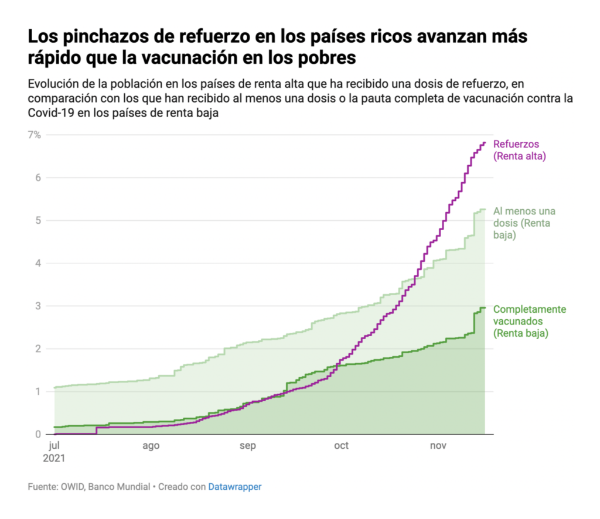
More money, more vaccines
“Vaccines alone will not end the pandemic, but we cannot end the pandemic unless we solve the global vaccine crisis,” Tedros Adhanom, Director-General of the World Health Organization, said weeks ago.
The alarm, which developing countries have replicated, is based on the fact that there is growing inequality in the administration of doses. For example, in November, a booster was administered to almost 7% of the population in high-income countries. This percentage exceeds that of inhabitants in low-income countries who have received at least one dose (5.3%) and doubles the proportion of citizens of emerging countries who have completed the basic guideline (3%).
WHO has a target of vaccinating 40% of each country’s population by the end of 2021. For that are needed an additional 550 million doses.
To show the dimension of these statistics, journalists Victòria Oliveres and Icíar Gutiérrez delved into the data on the application of more than 170 million doses, revealing how inequality and lack of solidarity (ES) in the international community keep humanity in danger.
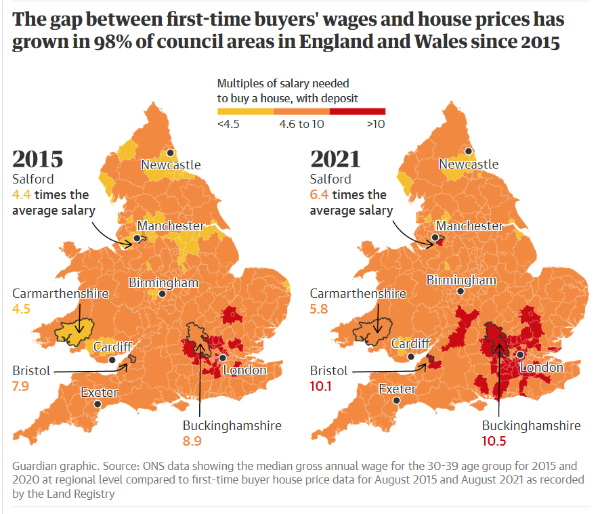
First-time homes have grown less affordable in the UK
Boris Johnson, Prime Minister of the United Kingdom, promised a year ago to turn the “rent generation into the home-buying generation.” He aimed to secure the conditions for more Britons to own their own homes.
The promise looks like it won’t be real. This research by Tobi Thomas, Pamela Duncan, and Hilary Osborne, Guardian journalists, into the prices paid by first-time homebuyers shows that since 2015 the affordability gap has grown in 98% of local authorities in England and all parts of Wales.
The analysis looked at what happened in the six years since the Conservatives won a majority government in the UK. The party’s 2015 manifesto stated that “everyone who works hard should be able to own their own home” and outlined plans for discounted starter homes and a Help to Buy, but the data shows that this has not happened.
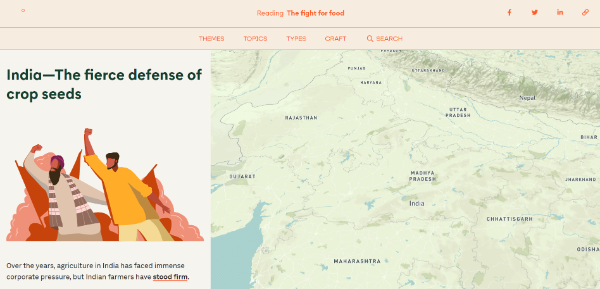
Asian farmers fight to save their crops
Their traditional agricultural practices are at risk from corporate pressure and laws that serve the interests of big business.
Kontinentalist journalist Gwyneth Cheng tells the story of how farmers in the region have united to defend their heritage and the livelihoods of millions. This point is vital. The conflict also depends on the consumer, who chooses what to buy and whom to give their money.
The basis and origin of agriculture; how it works and the types of crops grown; the contribution of agricultural production to the global economy; and stories about peasant union and the defense of heritage are elements that you will find in this factual report.
#EVENT
Digital Ethics Summit 2021
The Digital Ethics Summit, organized by techUK, celebrates its fifth anniversary in 2021. It will take place on December 8 between 9:00 and 17:15 GTM, is online and free of charge.
It will take stock of developments in the technology landscape from an ethical perspective over the past five years in the UK. Other topics that will be addressed are the strategies being promoted regarding disinformation, the ethics of Artificial Intelligence, and privacy at a global level. This last point is especially relevant: Boris Johnson’s government has just closed a citizen consultation on a reform proposal in this aspect. It raised alarms, showing severe indications of the executive’s intention to sell citizens' data to the markets.
You can check the agenda and register at Digital Ethics Summit 2021.
#CONSULTATION
Global perspectives on data trust
Data and its reliability are essential in a crisis context such as the pandemic. It can bring job opportunities to citizens through portals and databases with job offers, provide accurate health information, and highlight social gaps, such as gender.
Recent years have generated new management approaches designed to address the power imbalance for greater involvement of individuals and communities in deciding how data is used.
The interim draft of “Enabling data sharing for social benefit through data trusts”, by ODI, Aapti Institute, and GPAI, is open for public consultation as of November 13.
The paper seeks to understand better the knowledge, attitudes, and practices for generating reliable data around the world. You can access it and provide your input until December 8.
#CAMPAIGN
Orange the World
Violence against women and girls is widespread, persistent, and devastating.
“It affects women regardless of their age, background, or level of education. This violence takes many forms, such as physical, sexual or psychological violence, as well as abuse and economic exploitation,” Unesco explains.
The UN agency launched the Orange the World campaign to combat the problem, comprising 16 days of activism in favor of women’s rights between November 25 and December 10.
“The color orange symbolizes a better future, free of violence. It also demonstrates solidarity in eliminating all forms of violence and is therefore used as the color of the International Day for the Elimination of Violence against Women,” Unesco describes.
The campaign is supported by organizations such as the Council of Europe and countries such as the Netherlands, Belgium, Canada, Croatia, Cyprus, Czech Republic, Denmark, Estonia, Finland, France, Germany, Hungary, Italy, Luxembourg, Netherlands, Norway, Portugal, Romania, Slovenia, Spain, Sweden, and Switzerland.
Giving voice to women defenders, telling stories to address violence against women, and exploring ways to make our societies more is the work of the media. Join the campaign!
#30DayMapChallenge
In 2019 Topi Tjukanov, a Finnish geographer, created the #30DayMapChallenge, repeated every November. Each day corresponds to a map type and a category on types of visualization or thematic to be considered. Then, each participant decides how to carry it out.
In this post, you will find our selection of featured maps. You can get inspired and learn how to use this useful tool to illustrate your research. There are maps for all tastes. Some are made using particular color palettes, others represent navigation routes, others have been created on various supports, and some are absurd. Explore it!

#EDUCATION
Creating visual models
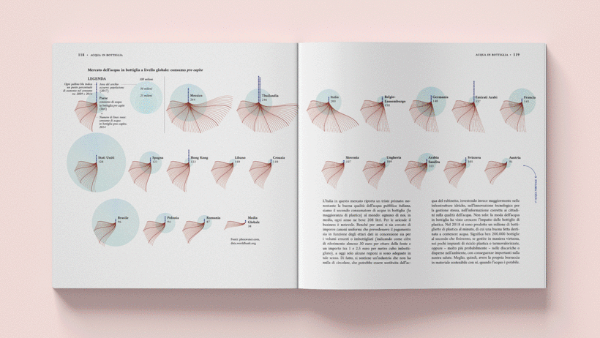
Federica Fragapane is a freelance data visualization designer. She has worked for organizations such as Google, the UN, Scientific American, and BBC Science Focus.
In this course at Domestica, Federica shares her process of finding visual inspiration to design an engaging piece that seamlessly communicates multiple layers of information.
It consists of 17 sessions, with additional resources and unlimited access. It is taught in English and has Spanish, Portuguese, German, French, Polish, and Dutch subtitles.
If you want to learn more about the course, we recommend reading this review published in Nightingale, The Data Visualization Society magazine.
Source: Domestika.org
That's all for now!
If someone sent you this email and you want to receive it twice a month in your inbox, subscribe!
We have other newsletters, which might interest you: